Hi, what do you want to do?
Texas Education Agency
Texas Gateway: Data Analysis
Given laboratory investigation data in the form of tables, charts, and graphs, students will analyze and predict trends from the data.
University of Texas
Inside Mathematics: Parking Cars [Pdf]
This task challenges a student to use their understanding of scale to read and interpret data in a bar graph.
National Center for Ecological Analysis and Synthesis, University of California Santa Barbara
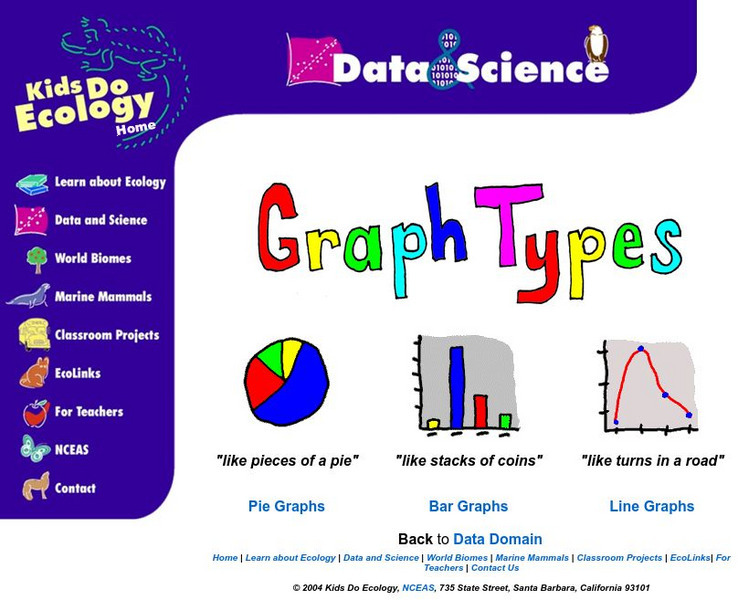
Nceas: Graph Types
At this site from NCEAS you can learn how to organize your data into pie graphs, bar graphs, and line graphs. Explanations and examples are given of each graph along with several questions that check comprehension.
Oswego City School District
Regents Exam Prep Center: Practice With Organizing and Interpreting Data
Several problems are presented to test your skills in creating and interpreting frequency tables, pie charts, box-and-whisker and stem-and-leaf plots.
PBS
Pbs Kids Afterschool Adventure!: Operation: All About Us Activity Plan
It's time to stand in the spotlight! During this Afterschool Adventure, children will learn about and practice a variety of math skills as they gather information about their favorite subject-themselves! Children will start out by...
Better Lesson
Better Lesson: Using Table Data: Time to the 1/2 Hour
My students have learned how to read and write time. Now I want them to see how important time is for us to organize our lives. I want them to use data charts for schedules and be able to analyze the information.
PBS
Pbs Mathline Lesson Plan: Struts'n Stuff [Pdf]
Incorporating concepts in algebra, number sense, patterning, data collection, and geometry, this instructional activity engages students in various hands-on activities to explore the relationship between regular polygons and the number...
PBS
Pbs: Mathline Creature Feature Lesson Plan [Pdf]
An interdisciplinary math, science, and language arts lesson that engages students in an exploration of statistics. Through a study of various forest climates, students utilize data collection and analysis, classification, and graphing....
Centers for Disease Control and Prevention
Centers for Disease Control: Survey and Data Collection
Site contains statistical data for the National Center for Health Statistics.
National Council of Teachers of Mathematics
Nctm: Figure This: Tv Ratings (Pdf)
Here's a challenge for the avid TV watcher. Use your data interpretation skills to explore America's TV watching habits in this NCTM Math Challenges for Families activity. See if you can figure out which night of the week has the...
University of Regina (Canada)
University of Regina: Math Central: Performance Stations in Math: Grade 6
The Saskatoon Board of Education provides teachers with this collection of grade six math performance stations. Although several of the stations have been designed as assessment tools for the Saskatchewan curriculum, teachers may also...
University of Regina (Canada)
University of Regina: Math Central: Performance Stations in Math: Grade 7
The Saskatoon Board of Education provides teachers with this collection of grade seven math performance stations. Although several of the stations have been designed as assessment tools for the Saskatchewan curriculum, teachers may also...
University of Regina (Canada)
University of Regina: Math Central: Performance Stations in Math: Grade 8
The Saskatoon Board of Education provides teachers with this collection of grade eight math performance stations. Although several of the stations have been designed as assessment tools for the Saskatchewan curriculum, teachers may also...
University of Regina (Canada)
University of Regina: Math Central: Performance Stations in Math: Grade 9
The Saskatoon Board of Education provides teachers with this collection of grade nine math performance stations. Although several of the stations have been designed as assessment tools for the Saskatchewan curriculum, teachers may also...
PBS
Pbs Kids Afterschool Adventure!: Operation: Martha's Stem Stories Activity Plan
Welcome to Martha's STEM Stories! STEM stands for science, technology, engineering, and mathematics. You may already know that doing STEM means testing ideas, collecting data, making calculations, and drawing graphs and charts-but you...
Alabama Learning Exchange
Alex: Charting the Weather
During this lesson, students will gather data from temperature and water gauges set up on the playground to learn about weather patterns. Then students will build a spreadsheet with data related to temperature, wind direction and amount...
Other
Stat Soft: Statistics Glossary
Dozens of statistical terms are defined and illustrated in this glossary.
BBC
Bbc: Ks1 Bitesize: How to Use Simple Data Tables
Explains how to read information from a simple golf scoring table. Students then label the rows and columns in a 2x3 table. [0:26]
Math Is Fun
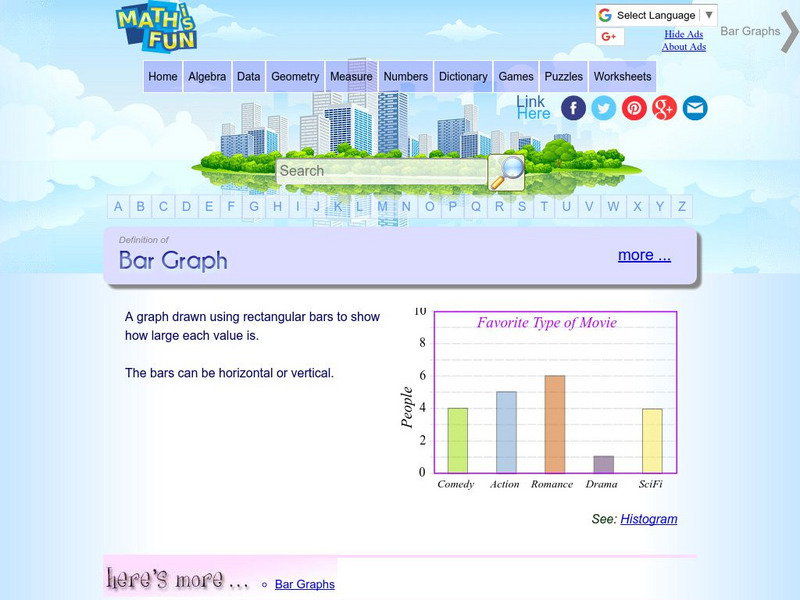
Math Is Fun: Definition of Bar Graph
Get the definition for a bar graph. Then, select the link "here's more" and use the interactive graph to display data as a bar graph, line graph or pie chart. The finished graph may be printed.
National Council of Teachers of Mathematics
Nctm: Figure This: Rose Bowl
A math challenge taken directly from the sports pages. Use your problem solving and data collection aptitude to find out how many different ways a Rose Bowl team could score 11 points. Try this one page activity from the NCTM Math...
Scholastic
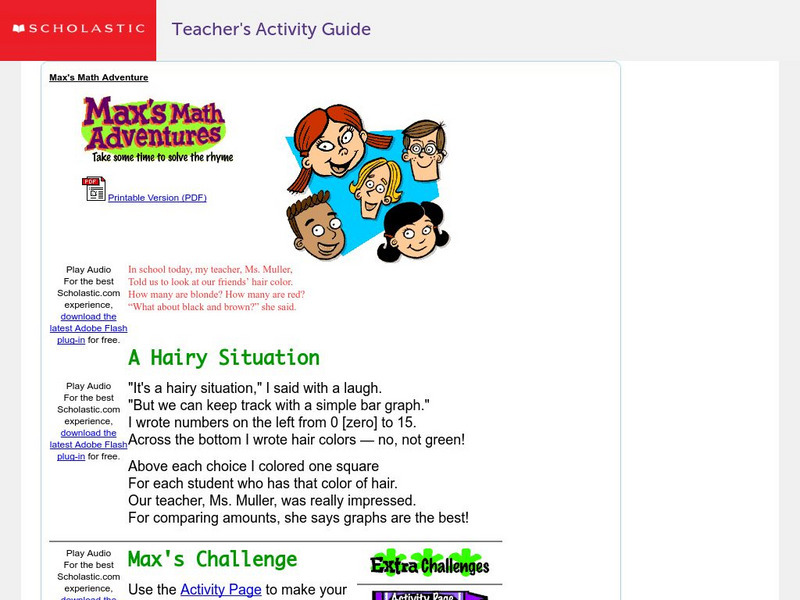
Scholastic: Max's Math Adventures: A Hairy Situation
Help Max make a bar graph to show the hair colors of his classmates. Teachers will appreciate the activities with bar graphs in the extra challenges. Use the teacher's guide to create a fun and engaging lesson.
Utah Education Network
Uen: Tallies Tell It All
This math instructional activity engages students into mathematical activities. Students will learn about tallying and data collection.
US Department of Education
Nces Kids: Creating an Area Graph
This is where you will find step by step directions explaining how to create an area graph. Complete each step and click on the next tab. Directions are simple and clear.
University of Cambridge
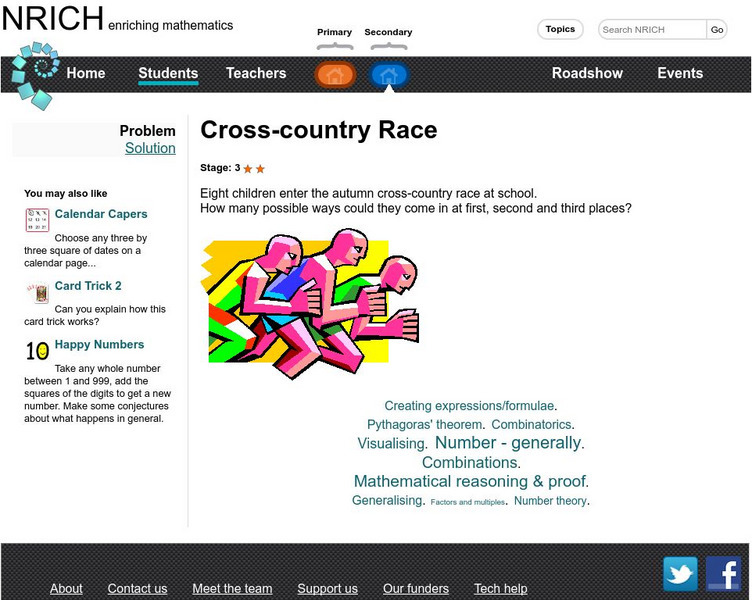
University of Cambridge: Nrich: Cross Country Race
On this one page website sharpen your logic and problem solving skills while working on this challenge. The solution is available to double check your solution.


![Inside Mathematics: Parking Cars [Pdf] Lesson Plan Inside Mathematics: Parking Cars [Pdf] Lesson Plan](https://static.lp.lexp.cloud/images/attachment_defaults/resource/large/FPO-knovation.png)
