Vision Learning
Visionlearning: Data: Data Analysis and Interpretation
An explanation of data from collection to analysis. Includes a discussion of how the same data may be interpreted various ways by different individuals.
NOAA
Noaa: Chesapeake Bay Interpretive Buoy System: Data in the Classroom
NOAA Smart Buoys collect and transmit real-time weather, water conditions, and water quality data. Chesapeake Exploration gives teachers and their students unprecedented access to lessons designed around real-time observational data from...
Vision Learning
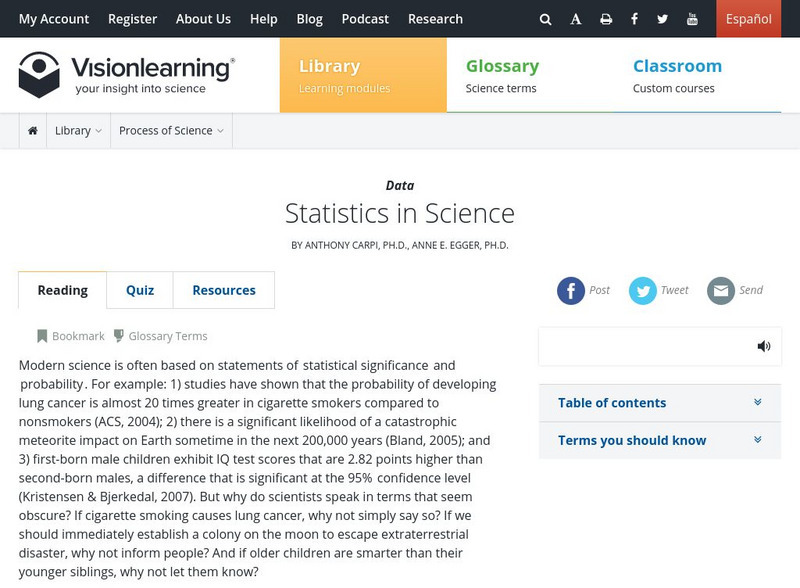
Visionlearning: Data: Statistics in Science
An explanation of how statistics allows scientist to explore the degree of uncertainty that accompanies conclusions that are based on data collected during experimentation and research.
Howard Hughes Medical Institute
Hhmi: Bio Interactive: Lizard Evolution Virtual Lab
Students explore the evolution of the anole lizard in this virtual lab. Students will collect and analyze data during the virtual lab that focuses on evolutionary biology and includes adaptation, convergent evolution, phylogenetic...
NOAA
Noaa: Be a Citizen Weather Reporter [Pdf]
Report the local weather to your community after deciding which data to collect and reading some of the National Weather Service's forecasting tips for amateur weather reporters.
Other
Univ. Of Copenhagen: Centre for Ice and Climate: Preserved Fossil Dna in the Ice
Discusses how fossil DNA data that is collected from ice cores is used by scientists to reconstruct the composition of past ecosystems and their biodiversity, as well as climates. There is a great deal of other information on the website...
BSCS Science Learning
Bscs: Heavy Metals in Waterways
This inquiry focuses on heavy metals in waterways in Colorado. Students will learn about heavy metals and data collected about them from citizen scientists, and then analyze the data in tables and maps to identify possible evidence of...
PBS
Pbs Learning Media: Link Between Arctic Sea Ice and Solar Radiation Absorbed
The Arctic plays an important role in regulating Earth's climate. The region reflects much of the Sun's energy and helps keep the planet cool. Data collected by NASA have revealed that sea ice in the Arctic has steadily declined over the...
Texas Education Agency
Texas Gateway: Chapter 7: How the Unemployment Rate Is Defined and Computed
By the end of this section, you will be able to do the following: Calculate the labor force percentage and the unemployment rate, Explain hidden unemployment and what it means to be in or out of the labor force, and Evaluate the...
Other
Stat Soft: Getting Started With Statistics Concepts
Definitions of the basic concepts in statistics. Great for review and discussion or for introduction into topics.
Illustrative Mathematics
Illustrative Mathematics: S Ic Words and Music Ii
Given a hypothetical situation, young scholars will decide if this is an experiment or observational study and why? They will also learn the importance of random assignments in this particular example. Explanations are provided.
Math Slice
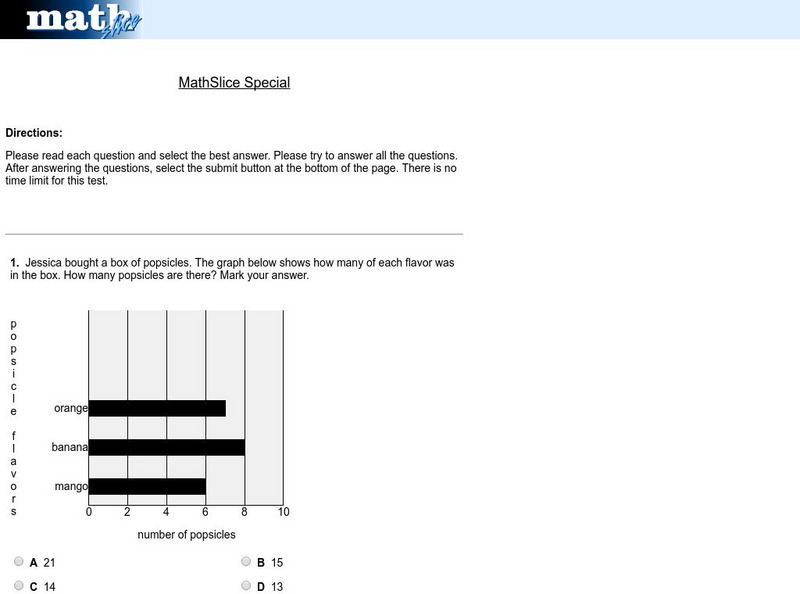
Math Slice: Chart Slice Special Test
A ten question test assessing data collection and analysis skills with bar graphs. Assessment is scored online. An excellent tool for assessment.
PBS
Pbs Learning Media: School Leadership in Action
This learning module includes several lessons designed to illustrate best practices in school leadership and spark conversation, reflection, and new thinking in schools and districts.
BSCS Science Learning
Bscs: Frog Eat Frog World
Using maps and graphs of large data sets collected in FrogWatch, students will determine the range, preferred land cover, and proximity to water of the American bullfrog to figure out the bullfrog's requirements for food, water, and...
Better Lesson
Better Lesson: Representing Our Own Surveys
After developing a survey questions and polling their classmates (in yesterday's lesson), 1st graders will now find a way to represent their findings and write a statement about what they noticed.
NASA
Nasa Earth Observatory: Should We Talk About the Weather?
Discover how scientists use the BOREAS to gather data such as heat, carbon dioxide, water vapor, and more to see what role these levels have on climate changes.
Science and Mathematics Initiative for Learning Enhancement (SMILE)
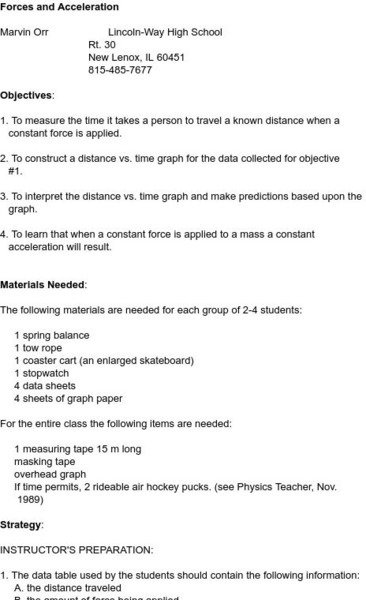
Smile: Lab Work Forces & Acceleration
The Illinois Institute of Technology provides this site. The site contains a graphing activity which illustrates that a constant force exerted upon an object results in constant acceleration. Rolling carts and stopwatches are used to...


