Curated OER
Interpreting Data and Statistics
Students define random sample and complete surveys. In this algebra lesson plan, students create surveys and define the way people analyze these results. They discuss random sample as it relates to the Great Depression and come up with...
Virginia Department of Education
Mystery Iron Ions
Young chemists perform an experiment to determine if a compound is iron (II) chloride or iron (III) chloride. Then they determine the formula, balance the equation, and answer analysis questions.
Rockefeller Archive Center
Understanding Mass Media News
In an age of fake news and photoshopped images, it is vital that 21st century learners development the skills they need to evaluate mass media and assess its validity. A great way to launch such a study is with a carefully crafted lesson...
Curated OER
Collecting Data and Graphing
Eighth graders, in groups, count the different colors of M&M's in each kind of package and then draw a pictograph to show the results. Each group writes a program to show their results and then compare the manually-drawn and computer...
Curated OER
Shopping Around
Third graders select a recipe and compare prices for ingredients at two different stores. They select the best place to buy the ingredients and answer questions about the process. They include their data on a spreadsheet related to their...
Curated OER
Comparing the Food Choices and Body Image of 15-Year-Olds Around the World
Students interpret data regarding food choices and the perceived body image of youth in the world. In this personal health lesson, students compare food consumption patterns in Canada with other countries. Students also compare lifestyle...
Curated OER
Sampling and Comparing Biodiversity
Young scholars compares the density and distribution differences of four species of spiders in two hypothetical habitats. They "sample" two habitats and then do calculations such as average density and relative distributions to compare...
Curated OER
Critter Encounter Chart
Students record data found at an assigned web site. In this data collection lesson, students access an assigned web site in order to complete a data chart about animals they see. They travel to different sections of the web site to find...
Curated OER
Comparing the Density of Iron
Students use scientific measuring tools to collect and use scientific data. They determine the density of four different objects by using their data to explain why objects have similar/different densities even though they are both made...
Curated OER
Oil Spill
Students use one of four absorbent products to separate as much of the oil and water mixture they are able to do. The purpose of this task is for students to collect and analyze data for the purpose of determining which absorbent is...
Curated OER
Creating and Reading a Pictograph
Second graders examine how data can be transferred into pictures on a pictograph. They analyze data on a graph about chewing gum, and create a pictograph that illustrates data about their preferences for the taste of bubble gum. ...
Curated OER
Checking Test Comparability/Scattergrams
Students construct a scattergram graph. In this statistics lesson plan, students graph data by hand and using a spreadsheet program. They establish lines of best fit and draw conclusions using their graphs.
Curated OER
Dental Arithmetic: Sugar Clocks
Students analyze data about their teeth. In this data collection lesson, students determine how often their teeth should be brushed during the day. Students also estimate the amounts of sugar in 17 foods.
Curated OER
Home Measurement
Students explore the differences between the heights of their family members as they measure, record, and compare the data gathered. Comparisons are made to discover who was the tallest and the shortest member.
Curated OER
Mathematics of Fair Games
Learners examine mathematicians' notion of fairness in games of chance. They work in pairs to perform three different experiments using macaroni and paper bags. They record their results on charts and compare their data.
Curated OER
Country Comparisons in Current Events Class
Students collect political, socioeconomic, geographical, and other data about 10 countries and record their data in a spreadsheet. The information is used to fuel current events discussions.
Discovery Education
It's Too Loud!
STEM scholars investigate sound attenuation by conducting an experiment in which they compare the farthest distance that they can hear a sound with and without ear protection.
Illustrative Mathematics
Bike Race
A graph not only tells us who won the bike race, but also what happened during the race. Use this resource to help learners understand graphs. The commentary suggests waiting until the end of the year to introduce this topic, but why...
Curated OER
Tools for Integrating Math and Engineering: Weighin' In
Learners collect and analyze data on a fictional cereal company's products. In this measurement lesson, students collect data from cereal boxes (weight, volume, surface area, etc.) to determine if the boxes labels correctly inform...
Curated OER
Fairy Tales
Sixth graders explore the elements of fairy tales. In this fairy tales lesson, 6th graders analyze several versions of Cinderella from around the world. Students graph fairy tale elements using Excel and create Venn diagrams comparing...
Curated OER
Creek Detectives WISE On-line Research Community
Learners investigate ways people cause harm to the environment. In this environmental lesson, students explore a case study on the Internet. Learners explore all of the online activities and collect data for a presentation.
PBS
Classification
Students explore classification skills used in scientific research. They classify a variety of objects in order to compare and contrast. In addition, they analyze previously collected data in order to place items into meaningful groups.
Curated OER
Chocolate Taste-Testing: Introduction to Loco for Cocoa
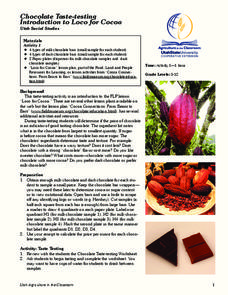
Students compare chocolates using their five senses and determine the value of the chocolate. In this chocolate activity, students sample various types of chocolate. Students study the price per ounce of each bar to complete the...
Curated OER
Breakfast Cereal - How Nutritious Is Yours?
Middle schoolers analyze the nutritional value of breakfast cereal in order to make an informed choice. They create a stem and leaf plot which analyzes the nutritional value of the cereal they eat on a regular basis. Students write a...
Other popular searches
- Compare Related Data Sets
- Compare Data Sets
- Compare Data in Graphs
- Compare and Record Data
- Compare Data Collection
- Compare Data on Graphs


