Curated OER
Describing Data
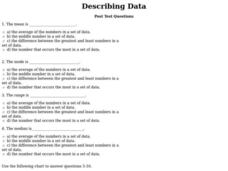
In this describing data worksheet, students answer multiple choice questions about mean, median, mode, and range. Students complete 10 questions total.
Curated OER
Learning to Make Data Tables
Students construct data tables using the results of previous experiments. In this graphing lesson, students plot data and interpret the results. Students discuss how they organized their data.
Curated OER
Tables and Data #3
In this tables and data worksheet, students use a data table to answer a set of 8 questions. A website reference for additional activities is given.
Curated OER
Tables and Data
In this table and data instructional activity, students use a given table of ticket sales to answer a set of 8 questions. A website reference for additional activities is given.
Mabry MS Blog
Scatter Plots
Scatter plots are a fun way to gather and collect relevant data. The presentation goes through several examples and then describes the different types of correlation.
Curated OER
Box and Whiskers
Middle schoolers discover how to relate collected data with a box and whiskers graph in a number of formats. They collect, organize, create, and interpret a box and whiskers graph. Pupils interpret the difference between sets of data,...
Raytheon
Working With Mode, Median, and Mean
In this data analysis worksheet, students solve five questions by finding the mode and median of each set of numbers. On the second page, students find the mean of six sets of numbers. On the third page, students find the mode, median,...
Curated OER
Atlatl Lessons Grades 4-12: Lesson for Beginning Users of Atlatl
Sixth graders determine the mean, range median and mode of a set of numbers and display them. In this data instructional activity students form a set of data and use computer spreadsheet to display the information. They extend of...
Curated OER
The Perfect Principal
Students demonstrate their understanding of math skills. In this data analysis lesson, students complete a worksheet requiring them to calculate mean, median, and mode, and create and interpret graphs. Lesson is intended as an assessment...
Curated OER
Designing the Experiment and Answering the Question
Students investigate scientific methods by analyzing an article from the Natural Inquirer. In this data analysis lesson, students read an article from the magazine and discuss at least 2 scientific methods that could be used to...
Curated OER
Create Your Own Form
Students gather and organize data using a mock census form, and determine mean, mode, range, and median for sets of data.
Curated OER
Range, Mean, Median, Mode
Students research the impact of craters. In this range, mean, median and mode lesson, students complete an experiment with a marble to simulate the effects of a crater. Students collect and analyze data finding the range, mean, median...
Curated OER
Human Face of Mathematics - Mathematics in Aboriginal Culture
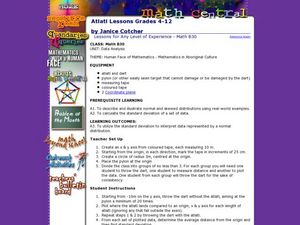
Students collect statistical data. In groups, students play a dart game and then determine the distance between darts. They collect the data and plot the information on a coordinate plane. They identify the mean and the...
Curated OER
High Temperature records by State
In this temperatures worksheet, students view a spreadsheet of the high temperatures of the states and change the data on it using spreadsheet tools. Students complete 4 tasks.
Curated OER
A Tall Story
High schoolers investigate the growth rate of a man named Bob Wadlow. In this growth rate of a man lesson, students determine if the growth rate of this particular man was normal or abnormal. High schoolers bring in data of...
Curated OER
Random Sampling
In this random sampling worksheet, students compare data collected by a random sample to data collected by an actual count using pieces of paper with numbers written on them. They compare their data for the actual count to the random...
Curated OER
Favorite Days
Students collect and organize data about themselves. In this data analysis lesson, students discuss their favorite calendar dates and explore ways to display the data.
Curated OER
Designing a Germination Experiment
Students explore botany by participating in a seed experiment. In this plant nutrition lesson, students define several science experiment vocabulary terms like observation, treatment, and replicate. Students utilize soaked seeds in a...
Curated OER
What's My Pattern?
Students recognize, describe and extend patterns in three activities. They organize data, find patterns and describe the rule for the pattern as well as use the graphing calculator to graph the data to make and test predictions. In the...
Curated OER
Traveling Through the Solar System
Learners use calculator and non-calculator methods for analyzing data. They apply data collection and analysis in a study of mass and weight. Students enhance and apply the concept of line of best fit. They master graphing in a plane,...
Curated OER
Lessons for Atlatl Users with Some Experience-Grade 5
Fifth graders throw darts, collecting data for distance traveled. In this data analysis lesson, 5th graders throw a dart using an atlatl. They calculate the speed for each throw and determine the best dart length for distance throws.
Curated OER
Venn Diagrams
Students collect and display data in a Venn Diagram. For this statistics lesson, students collect data, compare the data and make inferences about their data. They use the Venn diagrams to identify what the data have in common and how...
Curated OER
Our Favourite Halloween Treat
Students conduct a survey about Halloween candy and create a bar graph illustrating the data. In this data analysis lesson, stud nets are introduced to the topic with a discussion and survey, then the class creates a large graph and...
Center of Excellence for Science and Mathematics Education
A Sick Astronaut
Aspiring astronauts graph, interpret, and analyze data. They investigate the relationship between two variables in a problem situation. Using both graphic and symbolic representations they will grasp the concept of line of best fit to...
Other popular searches
- Comparing Two Data Sets
- Comparing Sets of Data
- Comparing Related Data Sets
- Comparing Two Sets of Data


