EngageNY
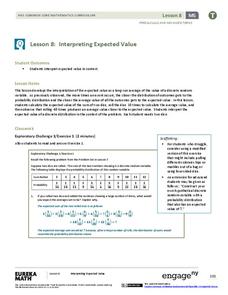
Interpreting Expected Value
Investigate expected value as a long-run average. The eighth installment of a 21-part module has scholars rolling pairs of dice to determine the average sum. They find aggregate data by working in groups and interpret expected value as...
Curated OER
Mathematics Lesson for Grade 10
There are four main topics in this bundle of lesson plans. They don't need to be taught sequentially. Each lesson has three parts: a starter, a main activity, and something to help consolidate and provide reflection on concepts learned.
Brine Shrimp: Getting to Know a Salt Water Arthropod
Gather small observations of arthropods. Using brine shrimp, pupils observe the life cycle of arthropods. Learners set up saltwater aquariums and observe the brine shrimp over a three-week period. To finish, they compare and contrast how...
Baylor College
Energy for Life (Energy from Food)
Energy comes in many forms, but how do living things get the energy they need to survive and thrive? In a simple, controlled experiment with yeast, water, and sugar, groups make observations about how yeast reacts with water alone, then...
Curated OER
What Time Is It? Part 2
Tell time to the half hour with these analog clocks! The first six problems invite first graders to write the correct times below, while the second set of problems provide the time and empty clock faces. A great way to review your time...
Curated OER
Mean, Median, and Mode 1
In this mean, median and mode activity, students use the measures of central tendency to describe given statistical data. Students identify the range of data, and match data to its representative bar graph. Two multi-step problems are...
Curated OER
Walking on Air
Young scholars collect and analyze data with a graph. In this statistics lesson plan, students use central tendencies to find the meaning of their data. They display the data on a Ti calculator.
Curated OER
M & Ms in a Bag
Students make predictions about the number and colors of M&M's in a snack size package. They create an Excel spreadsheet to record the data from their small group's bag, create a graph of the data, and discuss the variations of data...
Curated OER
Mean, Median, & Mode
Pupils determine mean, median, and mode. In this problem solving lesson, students evaluate a set of data to determine the mean, median, and mode. Pupils work in small groups practicing cooperative learning skills as they problem solve.
Curated OER
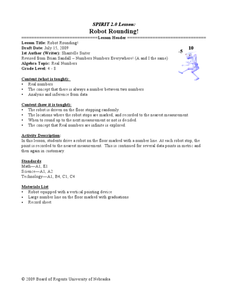
Robot Rounding!
Students collect data on a robot and relate the behavior to prove there is an infinite minute set of numbers. In this algebra lesson, students verify that there is always a number between two numbers. They analyze and make inference...
Curated OER
Introduction to Graphs: Bar Graphs, Line Graphs, Circle Graphs
In this graphing data worksheet, students answer 5 short answer questions about graphs. Students determine which type of graph best represents various data sets.
Curated OER
How High Are the Clouds?
Students analyze height and collect data to create a graph. In this statistics instructional activity, students use central tendencies to analyze their data and make predictions. They apply concept of statistics to other areas of...
Curated OER
Make a Line Graph
In this make a line graph worksheet, 6th graders make a line graph for 2 sets of data, using a blank grid, by plotting the numbers, labeling the x and y axes and writing a title.
Curated OER
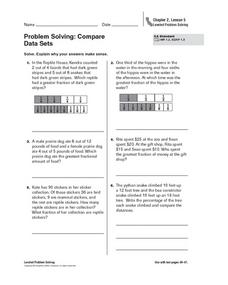
Problem Solving: Compare Data Sets
There are a variety of techniques students can use to compare fractions. In this learning exercise on fractions, 5th graders are shown a way to create a visual comparison and asked to solve word problems. Students are encouraged to draw...
Curated OER
FILLING IN THE GAPS - Acquiring and Analyzing Satellite and Ground-Based Data
Students monitor rainfall, compute daily averages, and compare their methods of computation to those used by actual researchers using satellite observations.
Curated OER
Graphing And Data Presentation
High schoolers engage in a study of science and mathematics with the practice of creating graphs. A guest speaker comes to the class to share statistics from the community and the students are shown how he uses the coordinate system in...
Curated OER
Introduction to Graphical Representation of Data Sets in Connection to Cellular Growth
Learners practice graphing relationships between variables by studying topics such as exponential growth and decay. They conduct a series of numerical experiments using a computer model and a variety of physical experiments using mold,...
Curated OER
Data Shuffle
Students find an advertisement or newspaper using charts or graphs. They create another graph using the same information in a different format. They write a comparison of the two graphs.
Curated OER
Data Analysis, Probability, and Discrete Math
Choose to supplement your probability unit with this resource and you won't be disappointed with the outcome. Teach young mathematicians to organize information using tree diagrams and lists in order to determine the possible outcomes of...
John Talavera
Autism iHelp – Sorting
Here is an app that will help kids sort objects! Sorting is an action that promotes cognitive flexibility and executive function. It is a key skill used in categorizing scientific data, making generalizations, and is foundational in...
Curated OER
Students Analyze Data With Scatter Plots
Scatter plot lessons can help students create different types of graphs by hand or with the aid of technology.
Curated OER
Origami Flight: The Physical Setting
Sixth graders investigate the forces that move certain objects. In this physics lesson, 6th graders design and create paper flying objects using origami methods, which they practice flying in different conditions. Students...
Curated OER
Ink Analysis and Thin Layer Chromatography
Students explain the process of TLC. They identify at least three components of ink. They analyze data and make conclusions based on laboratory observations.
Curated OER
How Do We Compare?
For this data analysis worksheet, students measure each other's height in centimeters and record the data on the given data table. Students compare the heights of the girls and heights of the boys.
Other popular searches
- Comparing Two Data Sets
- Comparing Sets of Data
- Comparing Related Data Sets
- Comparing Two Sets of Data
