Curated OER
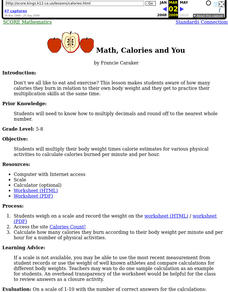
Math, Calories and You
Discover the connection between calories and weight. Pupils multiply their body weight times calorie estimates for various physical activities to calculate calories burned per minute and per hour. Worksheets a well as website links are...
Alabama Learning Exchange
The World of Integers
Review operations related to rational numbers and integers using the include PowerPoint presentation, "Interesting Integers." Young mathematicians classify rational numbers as being natural, whole, or integers and read an article about...
Rochester Institute of Technology
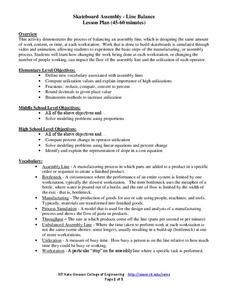
Skateboard Assembly - Line Balance
Utilize the lesson on utilization. The second installment of a nine-part technology/engineering series teaches scholars about the flow of a balanced assembly line and the definition of utilization. Videos, activities, and simulations...
Curated OER
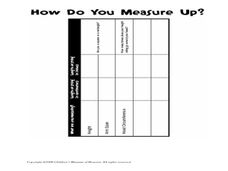
How Do You Measure Up?
Students measure their body. In this measurement instructional activity, students use a string to measure their height and the circumference of their head. They record this information on the worksheet provided and answer questions as a...
Curated OER
One Size Fits All, Part 1
Can you tell how tall someone is just by looking at their feet? In this activity, young mathematicians measure their height, arm span, and foot size, graph their findings, and answer questions about how these measurements are related....
Curated OER
Schoolyard Bird Project
Students observe and count bird sightings around their schoolyard throughout the school year.
Curated OER
Math: Currency Exchange Rates
Sixth graders apply the division and multiplication of decimals to convert dollars to various international currencies. In a travel simulation activity, they convert money, distance, and temperatures. During their "trip," students...
Curated OER
Graphing
Students collect data to create different types of graphs-line, pie, and bar graphs. They use StarOffice 6.0 to create graphs.
Curated OER
Texas History Math
Seventh graders practice math skills while they become familiar with Texas' Boom & Bust economy and the natural history of the east Texas Piney Woods.
Curated OER
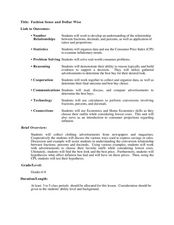
Fashion Sense and Dollar Wise
Students find the cost of an outfit. In this percentages lesson, students look at ads, pick out an outfit, and find the sale price. They create a commercial and complete 4 included worksheets.
Curated OER
Introduction to Fractals: Geometric Fractals
Learners study and observe the patterns made by the areas of the Sierpinski Triangle. Students use the computer to draw two or three iterations to discover the number patterns. Learners complete worksheets based on Geometric Fractals.
Curated OER
The Good, The Bad, The Ugly
Sixth graders examine the causes of the stock market crash of 1929. In this integrated math/history unit on the stock market, 6th graders study, research, and read stocks, visit a local bank, and create a PowerPoint to show the...
Curated OER
Whole Numbers
Student are assigned one of the sections on whole numbers. After reviewing the content, they teach their assigned sections to other class mates. They publish their findings on a PowerPoint slide show to use when they teach their section.
Pennsylvania Department of Education
Freckle Face
Students collect and record data. In this early data analysis lesson, students gather data about their partners face. As a class, the students use tally marks and pictographs to record the data and answer question about the information...
Curated OER
Barge Building: What Floats Your Boat?
Students construct aluminum foil boats that float while holding the greatest number of pennies. They investigate the concept of water displacement, record their results, and watch a Bill Nye video on buoyancy.
Curated OER
Paying for Crime
Students participate in activties examining ratios and proportions. They use graphs to interpret data showing the government's budget for prisons. They present what they have learned to the class.
Curated OER
Comparing Data on Graph A and Graph B
Second graders gather and graph data. In this graphing lesson, 2nd graders collect data and graph this information using tally charts, bar graphs, pictographs, or tables. They make predictions about the outcomes.
Curated OER
What's in Wetland Soil?
Students examine the organic and inorganic components of soil. In this environmental science lesson, students identify the factors that influence soil formation. They collect soil samples, conduct tests, and analyze the results.
Curated OER
Conversions: Metrics Made Easy
Young scholars, in groups, measure and record each other's height. They identify measurement conversion methods and use online resources to convert measured heights to multiple systems.
Curated OER
Rhythm In Motion
Sixth graders work independently and with a partner to demonstrate proficiency of steady beat, meter and basic note values while creating written rhythmic patterns for class performance. State and National Standards are addressed.
Curated OER
How much is a movie worth?
Young scholars discover how much a movie is worth. They use decimals and percentages greater than 100 to complete this activity.
Curated OER
Budget Finances
Students role play the role of a recent graduate of high school living on their own. Using play money, they are given one month's salary and they discover they own their own house or apartment and owe money on a car loan. They develop...
Curated OER
Mechanical Science - Small Engine Operation
Students experiment with two- and four-stroke engines. They conduct experiments to determine how atmospheric pressure affects the engine's running capability. Further tests are conducted to asses proper llubrication and its affects on...
