EngageNY
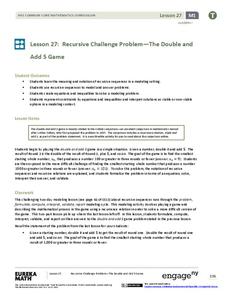
Recursive Challenge Problem—The Double and Add 5 Game
As a continuation of a previous lesson, this activity builds on the concept of calculating the terms of a sequence. Pupils are challenged to determine the smallest starting term to reach a set number by a set number of rounds. Notation...
EngageNY
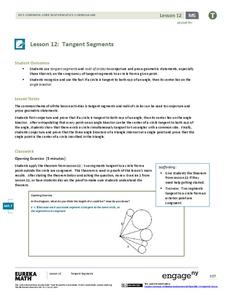
Tangent Segments
What's so special about tangents? Learners first explore how if a circle is tangent to both rays of an angle, then its center is on the angle bisector. They then complete a set of exercises designed to explore further properties and...
Ohio Department of Education
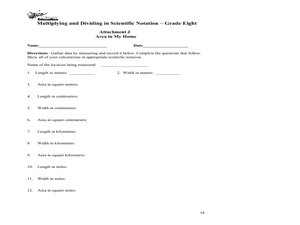
Multiplying and Dividing in Scientific Notation - Grade 8
Here is really nice set of resources on scientific notation. Eighth and ninth graders explore the concept of multiplying and dividing in scientific notation. In this multiplying and dividing numbers in scientific notation lesson,...
Curated OER
The Gum Drop
Students find the area of three figure by the traditional formulaic methods. Then they count the number of grid squares to double check. They show an intuitive sense of Pick's Algorithm by counting every two boundary squares as one unit....
Inside Mathematics
Snakes
Get a line on the snakes. The assessment task requires the class to determine the species of unknown snakes based upon collected data. Individuals analyze two scatter plots and determine the most likely species for five additional data...
California Education Partners
Least and Greatest
Squares can be magic. Pupils use their knowledge of addition of positive and negative rational numbers to create a 3 X 3 magic square where the sums are 1. Scholars create addition and multiplication expressions with a set of rational...
California Education Partners
Colorful Data
Scale up your lessons with a performance task. Young data analysts work through an assessment task on scaled bar graphs. They answer questions about a given scaled bar graph on favorite colors, analyze a bar graph to see if it matches...
Curated OER
Finding the Area of Shapes
In this area of shapes unit, upper graders participate in hands-on problem solving activities to find the formulas for the area of a parallelogram, a triangle, and a trapezoid. They manipulate the geoboard to explore relationships among...
Curated OER
V-Numbers
High schoolers explore problem solving strategies. Gin a novel situation, students develop a mathematical theory. Through models and mathematics, high schoolers justify their solution. Students definea V-sets and discuss conjectures...
Curated OER
Special Angles on Parallel Lines
Tenth graders investigate parallel lines and their special angles cut by a transversal. In this geometry lesson, 10th graders identify and find corresponding, alternate interior, and alternate exterior angles formed when parallel lines...
Curated OER
What Happens on Average
Fifth graders are introduced to convergence of sequences based on averaging previous terms in the sequence. The power of the "fill-down" function in spreadsheets is exploited. By using various starting numbers, and inferring the limit,...
Illustrative Mathematics
Operations with Rational and Irrational Numbers
Learners complete addition and multiplication tables that include rational and irrational numbers. They also answer a series of questions about the sums and products of irrational and rational numbers. One suggested modification would be...
Curated OER
Games for Probability: In-Class and Powerball Simulation
Your soon-to-be statisticians play a game to understand the difference between independent and dependent experiments and probability. They draw colored cubes from a bag and then, by either replacing the cube in the bag, or not, for each...
Curated OER
Boxing Up
Middle schoolers explore the relationship between theoretical and experimental probabilities. They use a box model to enter data provided and to randomly draw tickets from the box. Pupils click on any bar in a chart to display the...
Buffalo State
Adding and Subtracting Integers Unit
Just because one integer is larger than another doesn't mean it will make sense right away. Go beyond note taking and show learners, through the use of algebra tiles and a Four-Pan Algebra Balance, how the numbers relate to one another...
Curated OER
Exploring Special Segments in Triangles
Students discover that four special segments have a common intersection point. They identify the position of the intersection point in triangles. They produce conjectures about areas of the divided triangles.
Key Curriculum Press
Triangle Inequalities
Properties about triangles are explored in this lesson. Geometers make conjectures about the length of a triangle's sides, the length of the angles in relation to the length of the sides, and the measure of the exterior angles of a...
Curated OER
Investigating Patterns to Develop Logarithm Rules
In this logarithmic worksheet, students make conjectures regarding the rules for condensing and expanding logarithms by investigating patterns. This is designed to be done as a group activity.
Curated OER
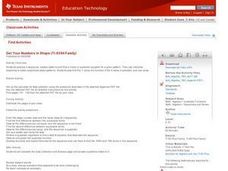
Get Your Numbers in Shape - TI-83
High Schoolers use the TI-83 calculator to produce a sequence, explore patterns and find a linear or quadratic equation for a given pattern. They use inductive reasoning to make conjectures about patterns. They find the Y-value of a...
Curated OER
Rectangles and Parallelograms
Students compare parallelograms and rectangles. For this comparing parallelograms and rectangles lesson, students make a chart to compare parallelograms and rectangles. Students are given set of quadrilaterals and they must classify...
Curated OER
Income Levels & Social Class: Is It All About Cash?
Students graph data and interpret that data after reading information about lifestyles and income levels. They calculate percentages, set up spreadsheets and calculate columnar data.
Curated OER
An Ancient Revolution: The Written Word
Students examine the Bible, one of the earliest written sources, as a compilation of narratives, and search the resources on the HERITAGE DVD-ROM for historical "proof" as well as create their own stories and scripts based on ancient...
Texas Instruments
Graphing Calculator Investigation Graphs of Relations
Learners investigate relations in this algebra lesson. They graph the set of ordered pairs that determine a relation. Using a TI-83 Plus, your learners will enter the coordinates in a list, create a scatter plot, and manipulate the...
Curated OER
Exploring the Centroid of a Triangle
Pupils examine the centroid of a triangle as they use Cabri Jr. to construct a triangle and its medians. The dynamic nature of the software allows learners to measure the lengths of the segments in the triangle and conjecture and verify...


