EngageNY
Connecting Graphical Representations and Numerical Summaries
Which graph belongs to which summary statistics? Class members build upon their knowledge of data displays and numerical summaries to connect the two. Pupils make connections between different graphical displays of the same data in...
Curated OER
How Many?
Establish 1:1 correspondence by counting students, first one gender, then the other. Give each child a colored cube (one color for boys, another for girls) and have small groups determine more or less and how many all together. As a...
EngageNY
Understanding Box Plots
Scholars apply the concepts of box plots and dot plots to summarize and describe data distributions. They use the data displays to compare sets of data and determine numerical summaries.
EngageNY
Distributions and Their Shapes
What can we find out about the data from the way it is shaped? Looking at displays that are familiar from previous grades, the class forms meaningful conjectures based upon the context of the data. The introductory lesson to...
Curated OER
Sweet Treats at the Carnival: Connect-the-Dots Game
In this math worksheet, students connect the dots from 1 to 10 to finish a picture of a child eating a sweet treat at a carnival. Students color the picture.
Illustrative Mathematics
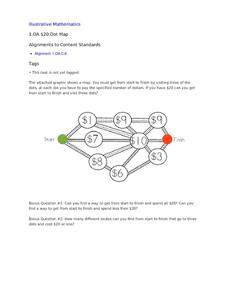
$20 Dot Map
Challenge the addition skills of young learners with this open-ended math problem. The task is simple, get from start to finish by connecting a series of three numbers. The trick is that the sum of the numbers must be less than...
Curated OER
Connect the Dots-1-10
In this connect the dots worksheet, students draw lines from numbers 1-10 to complete a picture of a fire engine, then color the picture. A reference web site is given for additional activities.
EduGAINs
Data Management
Using a carousel activity, class members gain an understanding of the idea of inferences by using pictures then connecting them to mathematics. Groups discuss their individual problems prior to sharing them with the entire class....
EngageNY
Sampling Variability and the Effect of Sample Size
The 19th installment in a 25-part series builds upon the sampling from the previous unit and takes a larger sample. Pupils compare the dot plots of sample means using two different sample sizes to find which one has the better variability.
Curated OER
Hidden Picture: Back-to-School "Puzzle"
In this language arts worksheet, students examine a detailed picture of a school and playground with 17 hidden pictures. Students locate the objects that are hidden by reading a story with highlighted words that give clues about what to...
Curated OER
Connect the Dots
Students practice counting to ten. In this coloring worksheet, students learn about the different types of trucks that transport goods by counting to ten and connecting the dots to complete the picture.
Curated OER
Lesson 10: Graphs
Students explore graph theory. In this geometry lesson, graphs are used to solve problems in a variety of domains. In this lesson the term graph refers to a collection of vertices and edges used to depict...
Curated OER
Rolling Number Sentences
Budding mathematicians investigate how to write number sentences using the Roll-the-Dice tool in "Kid Pix". They correlate the dots on the dice to numbers and then learn to use the addition and equal symbols to write number sentences....
Curated OER
Dots
Students read the story "Ten Black Dots." They brainstorm what you can do with dots. Students create a picture and a story with ten dots. They discuss how a computer uses dots. Additional ideas are listed for cross curriculum.
EngageNY
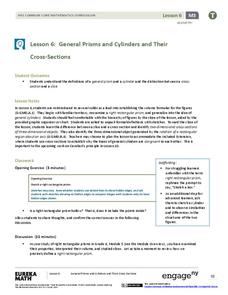
General Prisms and Cylinders and Their Cross-Sections
So a cylinder does not have to look like a can? By expanding upon the precise definition of a rectangular prism, the lesson develops the definition of a general cylinder. Scholars continue on to develop a graphical organizer...
EngageNY
Expected Value of a Discrete Random Variable
Discover how to calculate the expected value of a random variable. In the seventh installment of a 21-part module, young mathematicians develop the formula for expected value. They connect this concept the dot product of vectors.
EngageNY
Understanding Variability When Estimating a Population Proportion
Estimate the proportion in a population using sampling. The 20th installment in a series of 25 introduces how to determine proportions of categorical data within a population. Groups take random samples from a bag of cubes to determine...
Curated OER
Colored Dots 1
Students observe that colored markers are a mixture of many different colors by performing a chromatography experiment. They make observations, record information, and make generalized inferences from their observations.
Curated OER
Connecting the Dots? Geometry and Architecture
Students examine the connection between geometry and architecture. In this geometry and architecture lesson, students view a video which details a geometry class design project. Students then use the Internet in a scavenger hunt to find...
August House
The Clever Monkey Rides Again
How very clever. No need to monkey around with this resource. Rob Cleveland's version of the West African tale, "The Clever Monkey Rides Again," is used as the basis for multiple of cross-curricular activities including exercises...
Curated OER
A Human Number Line
Eighth graders act out a number line using integers -10 to 10 on large cards. They practice addition and subtraction of these integers to gain explain the relative size of numbers.
Curated OER
Isolines on a Weather Map
Ninth graders recognize isolines on a weather map and draw isolines based on temperature data on a weather map. They draw isotherms on a weather map to identify temperature patterns.
Curated OER
Things That Glow: From Fireflies to Quantum Dots
Third graders observe light energy. In this heat and energy lesson, 3rd graders will study the concept of light as a form of energy. Students will examine the different forms of light and the type of energy it produces.
Curated OER
Investigating Shapes in Our World
First graders explore shapes. In this geometry lesson, 1st graders make shapes with geo-boards, use play-dough to make three-dimensional figures, and make a shape book using pre-cut shapes.


