Curated OER
How Many Trees Can You Grow?
Students solve a story problem about how many trees can be planted in a given area. Using a map, they gather information about the size of the area and the dimensions of an acre. They use a specific equation to determine the area of...
Curated OER
Telling time to the quarter hour
Second graders identify how to tell time to the quarter hour. Then they complete a worksheet of twelve problems on their own given ten minutes and getting at least eight correct. Students also practice telling time as a class while the...
Curated OER
Identifying Ordinal Position To Twentieth
Third graders investigate the concept of putting ordinal numbers in order from one to twenty. They work in a group to hold cards with a number and then line up in numerical order. Then students recognize the number and play a game with...
Alabama Learning Exchange
I Scream for Ice Cream!
Students perform an experiment. In this combinations lesson, students complete an experiment where they find out how many ice cream cone combinations they can make with 5 different flavors of ice cream and 4 types of cones. They design a...
Curated OER
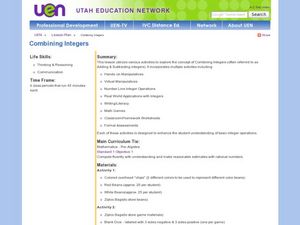
Combining Integers
Seventh graders explore the concept of adding and subtracting integers. In this adding and subtracting integers lesson, 7th graders use white and red beans to demonstrate adding and subtracting integers. Students play an on-line game...
Curated OER
Let's Talk Trash
Students identify class and types of materials in our environment. In this investigative lesson students work in groups to process information about what actions should be taken concerning solid waste.
Curated OER
Operations of Complex Numbers and Intro to DeMoivre's Theorem
Students solve problems with complex numbers. In this algebra lesson, students factor complex numbers and simplify equations using DeMoivre's Theorem. They add, subtract, multiply and divide using negative roots.
Curated OER
Different! Diverse! Dynamic! Lesson 1: Late Bloomers
Students examine how people grow and mature at different rates. They create a graph and a timeline to organize the data they collect.
Curated OER
A Statistical Look at Jewish History
Students complete their examination over the Jewish Diaspora. Using population figures, they discover the importance of percentages in exploring trends. They use their own ethnic group and determine how it is represented in the United...
Curated OER
Exemplary Plans, Engineer It!
Young scholars research tall buildings and identify the geometric shapes used in the construction of the buildings. They compare shapes and infer why some are better than others in building. They produce a multimedia presentation of...
Curated OER
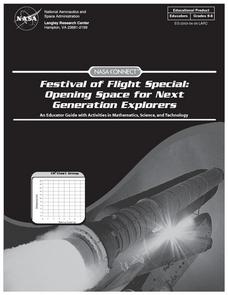
Festival of Flight Special: Opening Space for Next Generation Explorers
Students experience the dynamic skills and processes needed to design the next generation of launch vehicles at NASA. They view how mathematics, science and technology all work together to achieve excellence in human space flights.
Curated OER
How Much is a Million?
Fifth graders explore the relationship between customary and metric units of measurement. Through discussion and hands-on activities, they discover how units of measurement are related. Students create a millions book to aid in their...
Curated OER
Collecting Data and Graphing
Students practice collecting and graphing data using interlocking cubes. In this graphing lesson, partners count cubes and graph them. They also use a meter stick to measure arm span and height then compare the results with the class as...
Curated OER
It's So Simple
Students use basic materials to create four simple machines. In this introduction to simple machines instructional activity, students are given four different scenarios that require a simple machine in order to solve. The students use...
Curated OER
Design Patterns in Everyday Life
Students find symbols and patterns in everyday life. In this patterns lesson, students break into groups and look for specific patterns and symbols. Students record their findings. Students create a graphic organizer with the information.
Curated OER
Comparing and Ordering Integers
Students compare and order integers on an umber line. For this algebra lesson, students differentiate between positive and negative numbers. They plot point in the correct order on a number line.
Curated OER
Does Music Cam the Savage Beast?
Students collect, graph and analyze data. In this statistics lesson, students measure the heart beat of a person as they listen to music. They use the CBL and TI to create a graph, analyzing the outcome.
Curated OER
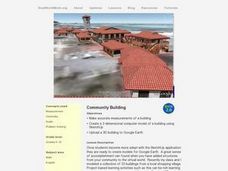
Community Building
Students build different shapes using sketches. In this geometry lesson, students explore measurements and units as they build and create models of buildings. They use SketchUp to create and manipulate shapes.
Curated OER
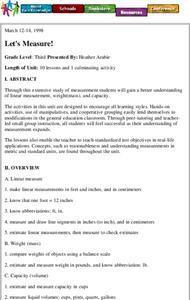
Let's Measure
Third graders practice measuring different objects. They discover the concepts of ratio and proportion and practice converting numbers into the correct unit. They read stories as well to help them with the concepts.
Curated OER
C is for Cookie-A MEAN-ingful Graphing Activity
Third graders, in groups, dissect a variety of brands of chocolate chip cookies and calculate the mean for each brand. They create their own bar graphs, pictographs, and line graphs to represent information.
Curated OER
Shape City
Students add to a class Shape City by designing and constructing new buildings.
Curated OER
Dinosaur Patterns
Students listen to story Dinosaurs Dancing, use dinosaur counters to identify, copy, create and extend pattern that is repeated at least three times, and complete web lesson.
Curated OER
Traffic Light Probability
Students discuss the possible traffic signals that may be observed on the way to a field trip. They record data on the trip, and analyze the probability of the results occurring again.
Curated OER
What a SHAPEly Fit!
Learners identify and explore the attributes of polygons. They design and create a quilt square using polygons, and produce a class quilt.


