Curated OER
Graphing Systems of Equations
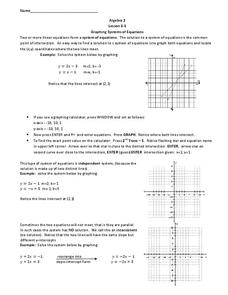
In this Algebra II instructional activity, 11th graders use graphing to determine the solution to a system of linear equations. The two page instructional activity contains explanation and three guided problems. Answers are not included.
Curated OER
Conics and Graphing
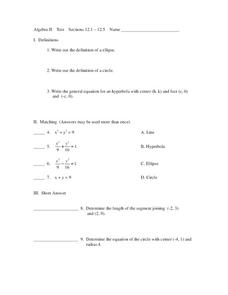
In this algebra worksheet, students solve equations by graphing an ellipse, circle and hyperbola. They match equations to graphs and define each type of function. There are 20 questions total.
Curated OER
Spaghetti Bridges
Students thread a piece of spaghetti through the holes in the cup. One person suspend the cup by placing each index finger approximately one inch in from the ends of the spaghetti.
Curated OER
Spaghetti Bridges
Eighth graders experiment with building bridges of spaghetti, pennies, and a cup to determine how varying the number of spagetti pieces affects the strength of the bridge. They graph their results and interpret the data.
Curated OER
Worksheet 33
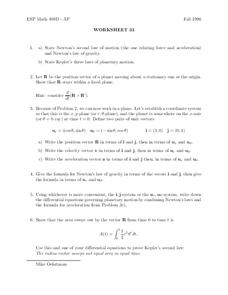
In this math worksheet, students state Newton's second law of motion and his law of gravity. Then they state Kepler's three laws of planetary motion.
Curated OER
Unit Circle Triangle
Students find the different ratios of a right triangle. In this geometry lesson, students apply the concept of the Pythagorean theorem as they identify the different angles and parts of a Unit Circle. They find the ratios of sine,...
Curated OER
Graph Functions: Practice
In this graph functions worksheet, students complete several activities to help them graph functions. Students use the table and the graph to complete the questions. Students also answer two test prep questions.
Curated OER
Bungee M&M's
Eighth graders experiment with M&M's and a cup attached to a spring to to simulate a bungee jump. They graph the results of the experiment and make predictions for continuing the experiment. They determine the "line of best fit."


