Curated OER
Linear Systems
Students solve and graph linear equations. In this algebra lesson, students solve systems of equations using elimination and substitution. They graph their answer and identify the point of intersection.
Curated OER
Linear Functions, Restricted Domains, Infinite Geometric Series, Interconnections
In this math worksheet, pupils graph the linear functions in comparison to the inequalities. Then they compare the line segments on the coordinate plane.
Curated OER
A Look At Osteoporosis
Eleventh graders study osteoporosis and understand the relationship between calcium and bone mass. In this investigative lesson students participate in an activity in which they graph and construct basic bone biology.
Curated OER
Finding Slope of a Line
Students calculate the slope of a line. In this algebra activity, students graph a line using the slope and y-intercepts. They define the steepness of the line using the slope.
Curated OER
Finding the Area of a Parallelogram with Translations
Students calculate the area of a parallelogram. In this geometry lesson, students perform translation using a coordinate plane and coordinate pairs. They perform translation on other polygons.
Curated OER
Investigating Pythagorean Triples
Learners investigate and solve Pythagorean triples. In this geometry activity, students find the missing sides and angles of a right triangle. They graph right triangles and move the sides around to create different angles.
Curated OER
Exploring Slope
Students explore the physical aspect of a slope. In this algebra lesson, students graph a slope and write an equation for a slope. They identify slopes of zero, negative lines and positive lines.
Curated OER
Maximum and Minimum Values
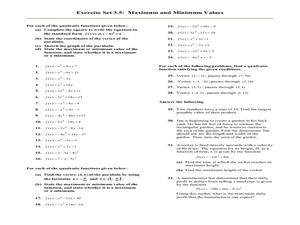
In this Algebra II worksheet, 11th graders complete the square to write a quadratic equation in Standard form. Students identify the vertex, sketch the graph and state the maximum or minimum value of the functions. The one...
Curated OER
Function Tables
Students identify function using tables of data. In this algebra lesson, students create a tale of point and plot on a coordinate plane. They analyze the graph as being a function or not.
Curated OER
Modeling Population Growth
Students collect data on population growth. In this statistics lesson, students graph their data and make predictions. They find the linear regression and the best fit line.
Curated OER
Iterating Linear Functions
Young scholars use a spreadsheet to investigate data. In this algebra lesson, students collect and graph data on a coordinate plane. They explain properties of a linear equation both algebraically and orally.
Curated OER
Linear Functions
Young scholars solve, identify and define linear equations. In this algebra lesson, students calculate the slope and y-intercept of a line. They graph the line given two points and the slope.
Curated OER
Distance Calculations
Students calculate the distance between two points. In this geometry lesson, students use coordinates and the distance formula to find the distance. They perform an interactive lesson to solve the missing length.
Curated OER
Modeling With Quadratics
Students investigate quadratics through word problems. In this algebra lesson, students models the number of registered males in apprenticeship programs. They investigate the transformation of quadratic function on a coordinate plane.
Curated OER
Algebra Exam
In this algebra worksheet, 11th graders graph, parabolas, absolute value and cubic functions. They factor polynomials and simplify roots. There are 75 questions.
Curated OER
Line, Ray, Segment
Students define vocabulary words. In this geometry lesson plan, students identify the graph as a line, ray or segments. They understand the properties of each and calculate the distance on a number line.
Curated OER
Parabolas
In this Algebra I/Algebra II worksheet, students identify the vertex and the axis of symmetry of a parabola, given the equation. The two page worksheet contains a combination of ten multiple choice and free response...
Curated OER
Reflection: Student Worksheet
In this math worksheet, learners will work independently to trace a stencil on an x-axis. Then students will follow a procedure to trace the image on the horizontal line of reflection. Learners will observe that reflections and rotations...
Curated OER
Math A Regents Questions: Points on a Line
In this linear equations worksheet, students solve 3 multiple choice problems. Students determine if a given point lies on a line given an equation of that line.
Curated OER
Parabolas
In this Algebra I/Algebra II worksheet, students determine the vertex and the axis of symmetry of a parabola. The two page worksheet contains a combination of eleven multiple choice and free response questions. Answers are...
Curated OER
Seasons
Students investigate the reason for seasons on Earth during three activities. They construct a model of the Earth and Sun to identify patterns in the changes of the angle of light on the Earth's surface. Then they conduct a heat...
Curated OER
School Sleuths Treasure Map
Learners are explained how a grid and compass work. They are also explained that archaeologists use grids as a record of the exact location of artifacts. Students define the term datum as a point of reference on grids from which all...
Curated OER
A Wet Welcome Home
Students investigate data collection and analysis. In this Algebra I activity, students create a scatter plot and find the equation of best fit in a simulation of a leaking water pipe.
Curated OER
Frequency Tables and Stem-and-Leaf Plots
Students are introduced to the function of frequency tables and stem and leaf plots. In groups, they determine the frequency of their teacher coughing, ringing a bell or raising their hand. To end the instructional activity, they...
Other popular searches
- Coordinate Graphing Pictures
- Holiday Coordinate Graphing
- Graphing Coordinate Planes
- Coordinate Graphing Worksheets
- Cartesian Graphing Pictures
- Coordinate Graphing Art
- Using Coordinate Graphing
- Coordinate Graphing Practice
- Algebra Coordinate Graphing
- Coordinate Graphing Distance
- Graphing Coordinate Pairs
- Graphing on a Coordinate Grid
