Curated OER
Discovering the Linear Relationship between Celsius and Fahrenheit
Students discover the linear relationship between degrees Farenheit and degrees Celsius. They manually compute the slope and y-intercept of the line passing through points. They convert Celsius to Fahrenheit degrees.
Curated OER
Let the Matrix Do It
Students create a matrix of the vertices of a triangle and produce new matrices that dilate, translate, rotate, and reflect the original triangle. After multiplying each matrix by a new scale factor, they graph the new matrix and...
Curated OER
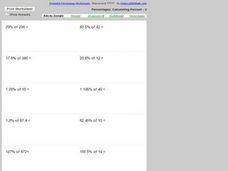
Percentages: Calculating Percent-1
For this percentages worksheet, students calculate percentages in eighteen problem solving percentage equations. Students show each step of their work.
Curated OER
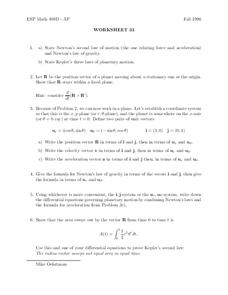
Worksheet 33
In this math activity, learners state Newton's second law of motion and his law of gravity. Then they state Kepler's three laws of planetary motion.
Helping with Math
Percentages: Calculating Percent - 2
Here is a worksheet on which math classes practice calculating the percentage of different numbers. Some of the percentages involve decimals, so this would not be an assignment for first-time percent calculators! You can print the...
Curated OER
Graphing Integers
Fifth graders explore the math concept of graphing integers. In this graphing integers instructional activity, 5th graders examine visual examples. Students also practice solving problems that their instructors model.
Curated OER
SAT Prep
In this secondary mathematics activity, students are provided with questions that are designed to provide SAT test preparation. The one page interactive activity contains ten questions. Answers are not provided.
Curated OER
New York State Testing Program Grade 8 Mathematics Test
In this eighth grade mathematics worksheet, 8th graders are presented with questions indicative of those on the eighth grade mathematics examination. The twelve page worksheet contains six free response questions that cover a variety of...
Curated OER
Linear Equations
In this algebra worksheet, students solve and graph linear equations. They differentiate between parallel and perpendicular lines. There are 35 questions about graphing.
Curated OER
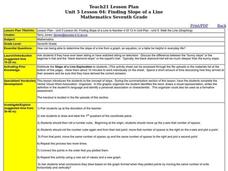
Finding Slope of a Line
Students calculate the slope of a line. In this algebra lesson, students graph a line using the slope and y-intercepts. They define the steepness of the line using the slope.
Curated OER
Graphing Inequalities and Shading
Students graph and shade inequalities. In this algebra lesson, students graph inequalities using the slope-intercept form. They shade the side of the line that is the solution and identify the domain and range.
Curated OER
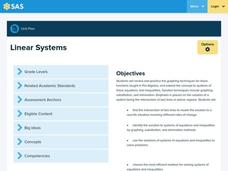
Linear Systems
Students solve and graph linear equations. In this algebra lesson, students solve systems of equations using elimination and substitution. They graph their answer and identify the point of intersection.
Curated OER
Deer Tracks
Students use satellite images to track to movement patterns of deer and examine deer behavior. They write stories about a day in the life of a field scientist.
Curated OER
Graphs and Ellipses
Students explore linear graphs, the parabola and the rectangular hyperbola.
Curated OER
Graphing With RXTE
Learners use data from the Rossi X-ray Tiiming Explorer (RXTE) satellite to analyze and graph.
Curated OER
Graph Functions: Practice
In this graph functions learning exercise, students complete several activities to help them graph functions. Students use the table and the graph to complete the questions. Students also answer two test prep questions.
Curated OER
Bungee M&M's
Eighth graders experiment with M&M's and a cup attached to a spring to to simulate a bungee jump. They graph the results of the experiment and make predictions for continuing the experiment. They determine the "line of best fit."
Curated OER
Math Grids
Fourth graders read an article, then search for verbs, adverbs, nouns, pronouns, etc. In groups, they exchange papers and try to guess what the other poem was about.
Curated OER
Which Color Will You Pick?
Students create a spreadsheet to chart the different colors found in a package of M&M's or Skittles. They collect data, create appropriate charts, and use percentages to describe quantities.
Curated OER
Percentages: Decimals To Percent
In this percentages worksheet, students write twelve decimals as percentages and twelve percentages as decimals. Students check their answers with the key when they are finished.
Curated OER
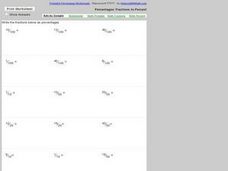
Percentages: Fractions To Percent
In this percentages worksheet, students write eighteen fractions as percentages. Students problem solve each fraction as a percentage.
Curated OER
Describing Situations Using Integers
In this math worksheet, learners answer the eight questions that are focused upon using integers. The tasks are meant to be done at home with your family.
Other popular searches
- Graphing Coordinate Pairs
- Plotting Coordinate Pairs
- Coordinate Pairs Pictures
- Coordinate Pairs Graphs
- Geometry Coordinate Pairs
- Coordinate Pairs on Maps
- Coordinate Pairs Worksheet
- Plottng Coordinate Pairs


