Hi, what do you want to do?
Other
Nearpod: Scatterplots, Correlation & Lines of Best Fit
In this lesson on scatterplots, students will learn how to create the line of best fit and analyze scatterplots by learning about correlations and causation.
Texas Instruments
Texas Instruments: Scatterplots and Correlation With Ti 89
Students input data relating the values of one variable associated with values of another and use these data to generate a scatterplot. From the scatterplot, they determine whether there is a correlation between the two variables and...
Khan Academy
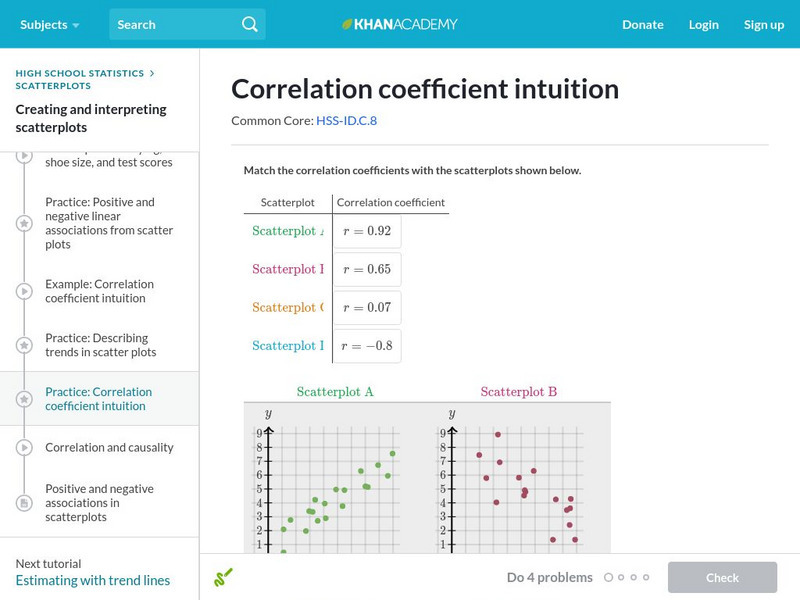
Khan Academy: Correlation Coefficient Intuition
Match correlation coefficients to scatterplots to build a deeper intuition behind correlation coefficients. Students receive immediate feedback and have the opportunity to try questions repeatedly, watch a video or receive hints.
CK-12 Foundation
Ck 12: Scatter Plots and Linear Correlation Grades 11 12
[Free Registration/Login may be required to access all resource tools.] This Concept introdices scatterplots and linear correlation for bivariate data.
Texas Instruments
Texas Instruments: Scatterplots and Correlation With Ti 83
Students learn how to enter a list of data and use these lists to graph two-variable statistics. They learn how to analyze the resulting scatterplots to assess the correlation between two variables.


