Hi, what do you want to do?
Oswego City School District
Regents Exam Prep Center: Scatter Plots and Line of Best Fit
Use this lesson, practice exercise, and teacher resource in planning instruction on scatter plots and line of best fit. In the lessons, you'll find definitions and examples of ways to make a scatter plot, determine correlations, and find...
Texas Education Agency
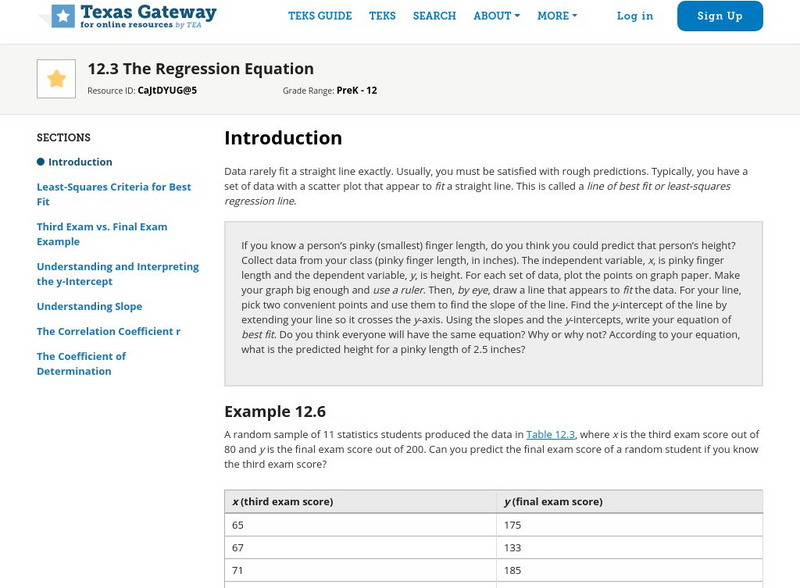
Texas Gateway: Tea Statistics: The Regression Equation
A tutorial on how to find the line of best fit or least-squares regression line for a set of data in a scatter plot using different methods and calculations.
Shodor Education Foundation
Shodor Interactivate: Regression
Plot a bivariate data set, determine the line of best fit for their data, and then check the accuracy of your line of best fit.
Texas Instruments
Texas Instruments: Line of Best Fit
In these questions, students will find the linear equation of best fit for a set of data and interpret the correlation coefficient. Questions are multiple-choice and true/false; solutions are provided.
University of Maryland
Maryland Sea Grant: Dendroclimatology
This is a set of lessons where students investigate tree rings and what scientists can learn from them. They measure tree rings and correlate the data to precipitation patterns in order to make predictions about the climate. For an...
University of Baltimore
University of Baltimore: Alternative Approach for Estimating a Regression Line
A quick, three-step approach to estimating the regression line of a set of data known as the "distribution-free method." Written by Dr. Hossein Arsham
Math Is Fun
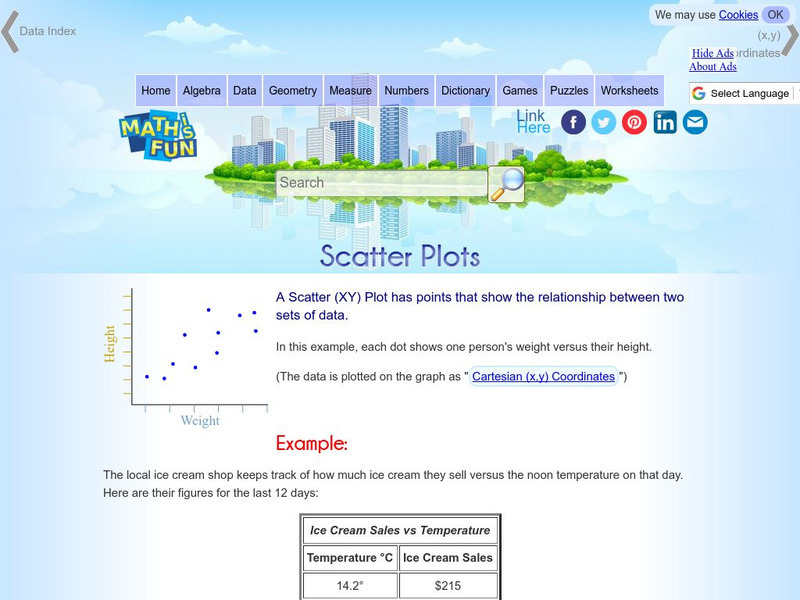
Math Is Fun: Scatter Plots
Explains, with examples, what scatter plots are and how to interpret the data. Discusses trends, interpolation and extrapolation, and correlation. Includes a set of practice questions.
Texas Instruments
Texas Instruments: Numb3 Rs: "Take Out" Outliers
Based off of the hit television show NUMB3RS, this lesson has students create box-and-whisker plots for given data, and then determine which (if any) data points are outliers. Students determine outliers through two methods in this...
Thinkport Education
Thinkport: Algebra Ii: Linear, Quadratic and Exponential Regression
Review linear regression and analyze how well this model fits the data. You will also be introduced to residuals and the correlation coefficient, and use these tools to determine whether or not a linear model is the best fit for a set of...
Alabama Learning Exchange
Alex: Statistically Thinking
The object of this project is for students to learn how to find univariate and bivariate statistics for sets of data. Also, the students will be able to determine if two sets of data are linearly correlated and to what degree. The...


