Curated OER
M&M Math
Students develop mathematical awareness. In this early math lesson, students predict the number of M&M candies in a bag, sort them into colors, and count them.
Curated OER
Bar Graphs Using M & Ms
Fifth graders observe an overhead of a graph on which M & Ms have been poured out. A volunteer comes up and separates the colors writing on the overhead how many there were of each color and another person labels the graph's title....
Starfall
Aa is for Apple
For this printing worksheet, learners form 11 upper and lowercase letter A's. Students color in pictures of words beginning with the letter and write two rows of A's on their own.
Starfall
Zz is for Zipper
In this printing instructional activity, students form the upper and lowercase letter Z. Students also color in two pictures, follow a Connect-the-Dots picture, and count words.
Starfall
Ee is for Eggs
Students learn to write upper and lower case DeNelian letters Ee for this printing practice instructional activity. Students trace several examples, write letters, color, and count eggs.
Curated OER
How Many? Numbers 1-5
In this numbers worksheet, learners color the correct number of M&M's that match a given number at the beginning of a row. Numbers used are 1-5.
Curated OER
Data Analysis and Probability: Graphing Candy with Excel
Collect and graph data using Microsoft Excel with your math class. They will make predictions about the number of each colored candy in a bag of M&M's, then sort, classify, count, and record the actual data before using Excel to...
Curated OER
100th Day Graphing
In this counting worksheet, students will use jellybeans or M&Ms for graphing the different colors. Students will sort the candies by color and count how many they have of each.
Curated OER
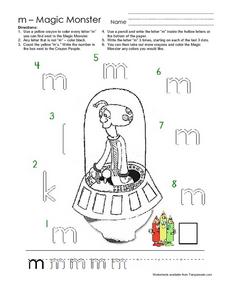
The Letter M: Magic Monster
In this letter m worksheet, students color every M they find in the Magic Monster picture yellow, and any other letters they see are colored black. Students count the M's and write the number they find, then practice writing the letter...
Curated OER
M & M Madness
Second graders graph M & M's by color. In this graphing lesson plan, 2nd graders first predict how many of each color they think are in a handful of M & M's. Then they graph the amounts of each color on a computer program....
Curated OER
Candy Addition and Subtraction
Learners practice computation. In this addition and subtraction math lesson, students count M & Ms and Skittles to answer math problems and complete a related worksheet.
Curated OER
M & M Math
Students sort M & Ms by a given attribute, and estimate how many M & Ms are in two bags. They graph their M & Ms and conclude which color they have the most and least of, then students combine sets of M & Ms together and...
Curated OER
Disaster Relief - You Can Count On Me!
Students practice stewardship. In this service learning lesson, students respond to those in need after a natural disaster as they investigate philanthropy.
Curated OER
M&M Ratios
Third graders explore ratios. In this probability lesson plan, 3rd graders sort and count M&M's and identify the ratios of different colors. Students use the attached worksheet as an assessment.
Curated OER
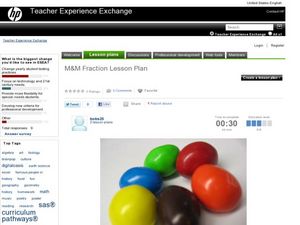
M & M Fractions
Students explore the concept of fractions using M & M candies as a manipulative. They sort the candies, and write the correct fraction for each color of M & M's.
Curated OER
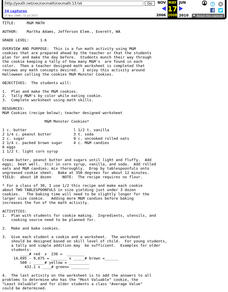
M&M Cookie Math
Students munch their way through a cookie keeping a tally of how many M&M's are found of each color.
Curated OER
Circle Up Your M&Ms
Fifth graders estimate how many M&Ms are in a pre-counted bag. They determine how many colored M&Ms are in a bag, then decide which of the two, bar graph or circle graph (in this case, circle graph) would be best to show te results.
Curated OER
M&M Graphing and Probability
Young scholars sort, classify, and graph M & M's. They create pictographs and bar graphs with the colors and numbers in each bag of M & M's. They calculate the ratio and probability based on class results.
Curated OER
The Magic School Bus in a Beehive
Students learn along with Ms. Frizzle's class. In this Magic School Bus lesson plan, students dance the Honey-Bee-Bop to communicate the location of hidden flowers.
Curated OER
Chocolatium
Students find the average atomic mass of M & M's. In this chemistry lesson plan, students are given a sample of the element chocolatium and the atomic mass of each sample. They then find the average atomic mass.
Starfall
Oo is for Octopus
Learners learn to print the upper and lower case DeNelian letter Oo in this language arts activity. Students trace several examples before forming their own letters in the unlined boxes. Also included is a Connect-the-Dot and counting...
Curated OER
The Statistics of M&Ms
Students explore the topic of statistics with M and Ms. For this math lesson plan, students use candy pieces to sort and gather information needed to create a bar graph. This lesson can be adapted to accommodate students in grades 1-12.
Curated OER
Problem Solving Using Percentages
Students explore the concept of percentages. In this percentages lesson, students find the percentages of various colored m&m's in their bags. Students find the cost of items before and after a discount. Students use proportions to...


