Virginia Department of Education
The Real Meal Deal
Burgers and salads and sodas, oh my! Scholars use a menu to investigate the Fundamental Counting Principle. They create tree diagrams to illustrate the number of possible choices for each given scenario.
EngageNY
Calculating Probabilities of Compound Events
Use tree diagrams with multiple branches to calculate the probabilities of compound events. Pupils use tree diagrams to find the sample space for probability problems and use them to determine the probability of compound events in the...
Project Maths
Fair Trials with Two Dice
Life's not fair, but dice games should be. After playing a two-person game with a pair of dice, scholars investigate the fairness of the game. They consider the number of possible outcomes using the fundamental counting principle and...
Math12
Basics of Probability
Give your middle schoolers a fighting chance at understanding probability. Offering numerous examples that clearly demonstrate basic probability concepts, this resource helps young mathematicians learn how to visualize the...
Virginia Department of Education
Organizing Topic: Probability
The probability is high learning will occur! A well-designed unit introduces learners to the concepts of independent, dependent, and mutually exclusive events. Using Venn diagrams, the lessons ask learners to analyze many different...
Curated OER
Students use fundamental counting principle to compute combinations and permutations
Students define Pascal's triangle and special notations used to represent nth elements. In this geometry lesson, students solve problems using permutations and combinations. They compare the formula for permutation to that of Pascal's...
Curated OER
Finding Probability
Students demonstrate how to find the probability of events. For this probability lesson, students use colored tiles in a paper bag and randomly select one at a time to record the probability.
Curated OER
Probability: The Study of Chance
Students conduct an experiment, determine if a game is fair, and collect data. They interpret data, then display line graph. They conduct analysis of game for probability.
Curated OER
Data Analysis, Probability, and Discrete Math
Choose to supplement your probability unit with this resource and you won't be disappointed with the outcome. Teach young mathematicians to organize information using tree diagrams and lists in order to determine the possible outcomes of...
Curated OER
Real-World Probability
Learners explore the concept of probability. In this probability lesson, students create a video, poster, or podcast explaining what experiments, sample space, events, and outcomes are in relation to probability. Learners...
Curated OER
Calculating and Applying Basic Probability
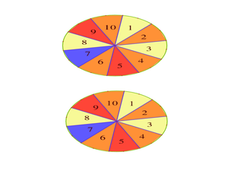
Eighth graders investigate the basic concepts of probability. In this probability lesson, 8th graders learn the associated probability. They work with spinners, colored cubes in a bag, flip coins, and choose colored candies while they...
Curated OER
Do You Feel Lucky?
Students explore probability by using games based on probable outcomes of events. They name all of the possible outcomes of an event and express the likelihood of such an event occurring.
Curated OER
Probability using M & M's
Using M & M's candies, young statisticians predict the color distribution in a packet of candies and test their predictions against their group and the larger class. A review of converting between fractions, decimals, and percents...
Curated OER
An Introduction to Counting
Students define the counting principle and how it relates to integers. In this algebra lesson, students add and subtract using the addition and multiplication principles. They solve problems using combination and permutations.
Curated OER
Probability: The Study of Chance
Students practice the basic principles of probability by conducting an experiment, determining if a game is fair, collecting data, interpreting data, displaying data, conducting analysis, and stating and applying the rule for probability.
Virginia Department of Education
What Are the Chances?
Take a chance on an informative resource. Scholars conduct probability experiments involving coins and number cubes to generate data. Compiling class data helps connect experimental probability to theoretical probability.
Curated OER
Computer Passwords
Students determine an appropriate numerical representation of a problem situation, including roots and powers. They determine an appropriate number of digits to represent an outcome. Pupils are asked to determine how many years it...
EngageNY
The General Multiplication Rule
In the first installment of a 21-part module, scholars build on previous understandings of probability to develop the multiplication rule for independent and dependent events. They use the rule to solve contextual problems.
Curated OER
Probability: the Study of Chance
Students experiment to determine if a game is fair, collect data, interpret data, display data, and state and apply the rule for probability. Students use a simple game for this experiment.
Curated OER
Let's Take a Chance!
Students investigate probability and the chance of an even happening. In this algebra lesson, students incorporate their knowledge of probability to solve problems and relate it to the real world. They learn to make decisions based on data.
American Statistical Association
How Tall and How Many?
Is there a relationship between height and the number of siblings? Classmates collect data on their heights and numbers of brothers and sisters. They apply statistical methods to determine if such a relationship exists.
Curated OER
Teaching with Collections
Students examine collections. In these real-world collections lessons, students examine and describe buttons and shells. Students will then sort, classify, and graph items according to various indicated descriptors.
Curated OER
Genes Count
Students view a video that reviews Mendelian genetics. They discuss the Hardy-Weinberg Law and use Popsicle sticks to simulate genetic variations and ratios in offspring.
Curated OER
Grade Data Analysis and Probability
Eighth graders display the outcome of given events by creating and reading tree diagram. They explain the relationship between addition and multiplication.
