CK-12 Foundation
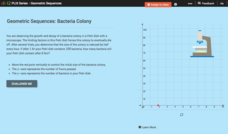
Geometric Sequences: Bacteria Colony
Show budding mathematicians how to model a diminishing bacteria colony two ways—graphically and algebraically. Using the coordinate axis, pupils create a graph to represent the decay of a bacteria colony. They determine the number of...
Curated OER
Skittles, Taste the Rainbow
Fifth graders learn and then demonstrate their knowledge of a bar and a circle graph using the classroom data. Students are given a pack of skittles candy. Students create a bar and circle graph indicating the results of the contents of...
Curated OER
Mathematics Within: Bar And Pie Graphs
Students compare and contrast the use of bar and pie graphs with the same data. They create a data set by surveying all students in the class using sticky notes to make a table on the board. Then, each student creates a bar and pie graph...
Curated OER
Line Graphs
Seventh graders create a line graph and identify when to use line graphs. In this line graphs instructional activity, 7th graders analyze the average temperatures of various cities. Students graph the data they collected.
Curated OER
Investigating: Interpreting Graphs and Analyzing Data
Students explore statistics by researching class birthday data. In this data analysis lesson, students investigate the different birthdays among their classmates and create data tables based on the given information. Students view bar...
Curated OER
Graphing Fun
First graders analyze objects and make a graphing picture to analyze the data. In this graphing lesson, 1st graders complete an object graph assessment, a picture graph assessment, and a bar graph assessment to analyze their given objects.
Curated OER
Favorite Food Graph (Blank)
In this math instructional activity, students create a bar graph to display the results of "your Favorite Food Survey." The graph is not labeled but has spaces for all the choices.
Curated OER
Graphing Favorite Fruit
Third graders take poll and sort data, enter the data to create a spreadsheet and create bar and pie graphs.
Curated OER
“My Little Sister Hugged An Ape” | Literature, Math, & More!
Students read the story "My Little Sister Hugged An Ape" and make a list of sensory words from the story. In this interdisciplinary math lesson, students participate in sensory writing, and complete a questionnaire which they will use to...
Curated OER
So Fast! So Slow!
Fifth graders give examples of objects that move slow and fast. In this physics lesson, 5th graders rank animals according to how quickly they move. They create a bar graph of organisms versus rates of speed.
Curated OER
Graphing Our Favorite Candy Bars
Students use ClarisWorks to graph class' favorite candy bars on a bar graph.
Curated OER
Introduction to Graphs
Learners poll classmates to gather information for a graph. They identify three types of graphs (bar, line, table). Students create each type of graph using data gathered from classmates.
Curated OER
Graphing Favorite Holidays
Students create spreadsheets and bar graphs based on results of survey of favorite holidays.
Virginia Department of Education
Numbers in a Name
What's in a name? Pupils create a data set from the number of letters in the names of classmates. Each group then takes the data and creates a visual representation, such as a histogram, circle graph, stem-and-leaf plot, etc.
Curated OER
Math, Sweet Math Activity Sheet
In this candy graphing learning exercise, 1st graders will place candy on their paper to create a bar graph. They will answer several questions based on their data. A teacher checklist is provided.
Georgia Department of Education
The Basketball Star
Have learners use math to prove they are sports stars! Assess a pupil's ability to create and analyze data using a variety of graphs. The class will be motivated by the association of math and basketball data.
Curated OER
Environmental Graphing
Pupils experiment with graphing. In this graphing introduction lesson, students complete four activities: 1) a bar graph based on class birthdays 2) an estimation graph of the raisins in raisin bread 3) another estimation example with...
Curated OER
Flavorful Spreadsheets
Learners create a spreadsheet which includes a bar graph. They sort and classify information and use the average function on a spreadsheet. They research Skittles candy and summarize their findings on a spreadsheet.
Curated OER
Civic Engagement: Community and Social Action
Explain that today's project is that learners will get groups create a survey to poll their classmates on what they do to stay healthy. The results will then be shown on a bar graph.Students brainstorm ways of keeping healthy and teacher...
Curated OER
Data Analysis Challenge
In this data analysis worksheet, young scholars work with a partner to collect information for a survey. The information is then compiled into a graph. Students must indicate their survey question, the target audience, predict the...
Curated OER
Twelve Days of Christmas--Prediction, Estimation, Addition, Table and Chart
Scholars explore graphing. They will listen to and sing "The Twelve Days of Christmas" and estimate how many gifts were mentioned in the song. Then complete a data chart representing each gift given in the song. They also construct...
Curated OER
Measuring Mixed Numbers
Mixed numbers can be added conceptually, algorithmically, and physically. Have the class visualize mixed numbers by adding fraction bars together. They then discover the algorithmic process that simplifies adding mixed numbers. Finally,...
Oklahoma State University
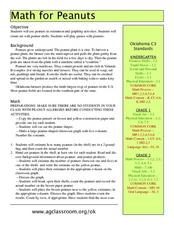
Math for Peanuts
Peanuts! Get your peanuts! Kids explore math, art, and agriculture concepts focused on peanuts. There is a brief informational text to get them started, and you'll find definitions of five in-text vocabulary words to address. Kids...
Curated OER
The Average Kid
Students determine the traits they have in common with other students in the class and create visual profiles of the "average" boy and the "average" girl.


