Curated OER
Creating a Bar Graph Using a Spreadsheet: Dice Rolling Probabilities
Tenth graders explore the concept of spreadsheets. They create a simple spreadsheet and chart from given data. Students perform basic formatting procedures on their chart. They use spreadsheet functions to perform calculations.
Curated OER
Graph It!
First graders use organized data to construct real object graphs, picture graphs, and bar-type graphs.
Curated OER
Interpreting and Displaying Sets of Data
Students explore the concept of interpreting data. In this interpreting data instructional activity, students make a line plot of themselves according to the number of cubes they can hold in their hand. Students create their own data to...
Curated OER
Make a Frequency Table and a Histogram for a Given Set of Data
In this data recording and data organization instructional activity, students create one frequency table and one histogram for a given list of data. Explanations and examples for frequency tables and histograms are given.
Curated OER
Mathematics Within: Bar And Pie Graphs
Students compare and contrast the use of bar and pie graphs with the same data. They create a data set by surveying all students in the class using sticky notes to make a table on the board. Then, each student creates a bar and pie graph...
Curated OER
Where in the World Do Those Cookies Come From?
Students discuss exports and imports by discovering where the ingredients come from for making chocolate chip cookies. They take a survey of their favorite cookies and create a bar graph to represent the information.
Curated OER
Do You Measure Up?
Students measure their height and then they will input the information into a spreadsheet. After the data is entered, students will use the material gathered to create a bar graph showing the heights of people in their class.
Curated OER
Data Handling
In this data handling worksheet, students explore multiple ways to represent data. They create stem and leaf plots, histograms, and bar charts. Students examine and interpret diagrams and statistics. This eleven-page...
Curated OER
Graphing Aquatic Insects
Students identify aquatic insects. In this organism instructional activity, students locate aquatic insects near a local waterway and collect them. Students graph the amount of insects that they collected.
Curated OER
Our Favorite Season Lesson Plan
Fifth graders complete a survey about their favorite season of the year. Using Excel, they create a graph using the chart wizard and copy it into Microsoft Word. They explore the relationship between the survey and the bar graph.
Curated OER
Rouge River Data
Students participate in using Excel sofware in order to create graphs. They create the graphs using data that they gathered during the Rouge River Field Trip they attended. The produce bar graphs from the excel spreadsheets.
Curated OER
Bird Bulletins
Students, in groups, create a survey to investigate how much their community knows about birds. They graph their findings using a bar graph. Using the data collected, they develop an advertising campaign to increase community awareness...
Curated OER
Bananas! Bubble Gum! Which One?
Students design and create a graph of data they have collected on their favorite candy bars. They explore how to organize data as well.
Curated OER
Tree Measurement
Students work in pairs taking measurements of a tree. They measure the trunk, crown, and height using vertical and horizontal measurement. Then students create a bar graph using the information they gathered.
Curated OER
Our Favourite Halloween Treat
Students conduct a survey about Halloween candy and create a bar graph illustrating the data. In this data analysis lesson, stud nets are introduced to the topic with a discussion and survey, then the class creates a large graph and...
Curated OER
Understanding Presidential History
Students research to find the qualifications necessary to be President of the U.S. In this presidential qualification instructional activity, students research their family roots to see if they could qualify to be President. Students...
Curated OER
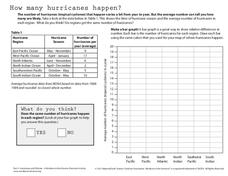
How Many Hurricanes Happen?
In this hurricanes worksheet, students use a data table showing the hurricane region and the average number of hurricanes per year to determine if the same number of hurricanes happen in each region by creating a graph. Then students...
Curated OER
A Class Census
Students recognize that data represents specific pieces of information about real-world activities, such as the census. In this census lesson, students take a class and school-wide census and construct tally charts and bar graphs to...
Curated OER
Food Chains
Students study food chains by creating their own slide show using KidPix. They compare information after sharing their slide shows as a whole group. As the children are watching the slide shows of their peers, they tally every time...
Curated OER
Mapping the Ocean Floor
Students construct and interpret a line graph of ocean floor depth and a bar graph comparing the height/depth of several well-known natural and man-made objects and places. In addition, they calculate the depth of two points using sonar...
Curated OER
Jelly Bean's Galore
Students investigate the origins of the Jelly Bean. They complete a Scavenger Hunt using the jellybean website. Pupils create a bar graph using information collected about jelly beans. Students discuss the time of year that Jelly Beans...
Curated OER
Data Analysis and Probability Race to the Finish
Learners practice addition facts, record data, and construct a bar graph. In this probability lesson, students participate in a board game in which bicycles move towards a finish line based on players completing addition problems. Dice...
Curated OER
Temperature in the Sun or Shade of the Desert
Third graders use thermometers to measure the air temperature in several
places around the school and then return to the classroom to record the data. They create a bar graph and discuss their findings about the air temperature in the...
Curated OER
An Inside Look at Apples
First graders examine and identify parts of an apple. In this biology lesson, 1st graders cut an apple in half and locate all the parts, use the apple halves as stamps, and create a bar graph displaying which apple types the...

