Curated OER
Can you Find the Expression
Learners collect data from measurements and weights for this experiment. In this algebra lesson, students analyze graphs they create form their data to find the expression representing the data. They label which graph provided the best...
Curated OER
Favorite Farm Animals
Students perform a study of farm animals and their babies. They compile a graph of their favorite farm animals. They utilize a spreadsheet worksheet which is imbedded in this plan.
Curated OER
Population Pyramids
Students create a population pyramid based on current data for their final project country. They analyze data from comprehension trends of final project country. Students analyze populations of specific countries.
Curated OER
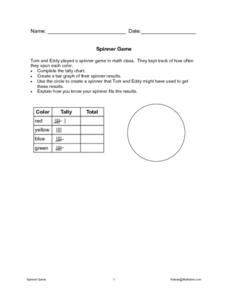
Math Spinner Game
In this math game activity, students complete a tally chart by filling in the "total" column of a graphic organizer. Students then create a spinner that might have been used to get the results shown and then explain how they know the...
Curated OER
Grade 2: Spinning Sums
Second graders collect data by spinning two spinners and creating sums, organize the data, and make conclusions from the data. Each students makes a spinner. They spin and record the number of the section each time. Students work in...
Curated OER
Classification Introduction
Students simulate classifying rocks using different colored skittles. In this earth science lesson plan, students create a Venn diagram according to their compiled information. They share this diagram in the class.
Curated OER
Butterflies in the Garden
Learners estimate the population of a butterfly ecosystem and create a chart and graph based on information they find.
Curated OER
Following Directions
Students explore the way astronauts practice and train to improve their efficiency in completing challenging tasks. They time and graph how long it takes to follow a list of directions. Also, they determine how practice and repetition...
Curated OER
Statistics: Misleading or Accurate?
Students explore the concept of misleading statistics. In this misleading statistics instructional activity, students play a game of tag and graph the number of times each student gets tagged. Students use the graph to determine the...
Curated OER
Crime School Investigations
Students solve a mystery at their school. In this classifying lesson, students find suspects who committed the crime. Students categorize them into race, sex, and fingerprint type. Students show their results in graphs.
Curated OER
Map Making/Floor Plans/Map Reading
Students apply their knowledge of scale when mapping the classroom. They determine the use of a map legend and orient a map using a compass. They create the classroom maps using transfer graph paper.
Curated OER
The Dog Days of Data
Students practice an alternative form of data presentation. They practice sequencing data, identifying the stem-and-leaf, creating stem-and-leaf plots, and drawing inferences from the data by viewing the plots.
Curated OER
Statistics Newscast in Math Class
Students study sports teams, gather data about the teams, and create a newscast about their data. In this sports analysis lesson, students research two teams and define their statistical data. Students compare the two teams, make...
Curated OER
Making a Map
Students are introduced to maps by examining the various types and practice using a key to find information. They each create their own map with a key and graph information. As a class, they read the story "Henny Penny" and share their...
Curated OER
Campaign 2000
Students research newspapers and the Internet to learn about the election. Students work in groups and choose a state that they want to compare to Florida. Students organize the data they have found into a graph labeling an "x" and "y"...
Curated OER
Planet Protectors
Students explore ways to protect the earth. In this environmental issues and technology lesson, students investigate the water quality in their community and compare their findings to the water quality in other geographic...
Curated OER
Who Do You Want For Your Friend?
Second graders create a t-chart about the healthy and unhealthy characteristics in relationships. They discuss elements they should look for in a friend. They are read books to identify these elements.
Curated OER
A Healthy Heart
Sixth graders create a spreadsheet using specific data. A speaker comes to discuss the heart, and the difference between anaerobic and aerobic activity. They make posters to encourage a healthy heart lifestyle.
Curated OER
Sunrise, Sunset: Quickly Go the Days
Students explore the concept of daylight. In this daylight lesson plan, students compare the amount of daylight on a particular day in Anchorage compared with daylight where they live. Students color maps of the US according to amount of...
Curated OER
Baseball - America's Pastime
Students complete Internet research about baseball and baseball players. They complete a variety of activities including writing an epitaph for Jackie Robinson, a news article about him, and make graphs displaying salaries of a number of...
Curated OER
Lucky Charms Pictograph
Third graders create pictographs using a breakfast cereal. This fun, hands-on lesson allows students to use Lucky Charms cereal to create a pictograph. When the lesson is through, 3rd graders get to eat their Lucky Charms marshmallows.
Curated OER
I'm a Weather Watcher Watching plants grow by......my,my,my
Young scholars investigate how weather affects how plants grow. They collect data on weather and plant growth for a week and display the data on a graph. For a culminating experience they design a movie using software that shows plant...
Curated OER
In the Right Mode
Sixth graders practice determining mean, median, mode, and range using individual mileage logs. They convert miles to kilometers and graph their results.


