ArtsNow
Arts Now Learning: We Are Living Graphs and Data [Pdf]
In this lesson, 3rd graders use their own bodies to create bar graphs and do problems involving addition, subtraction, and more or less amounts. They then create their own graphs, incorporating the features of graphs that they have...
US Department of Education
Nces: Create a Graph: Kids Zone
Make your own pie, bar, line, area or XY graph with this interactive tool. Look for examples of graphs already created from data collected by the National Center for Education Statistics. Complete with a graphing tutorial.
Other
Meta Chart: Create a Single Bar Chart
Design and share single bar charts with this web-based tool.
University of Vienna (Austria)
The Graphs of Sin, Cos, and Tan Maths Online
This applet allows the user to create the graphs of sin, cos, and tan by moving a scroll bar. The user can watch the unit circle and the graph simultaneously to see how the two are related. The user may also choose to see the angle...
ClassFlow
Class Flow: Ice Cream Bar Graph
[Free Registration/Login Required] This flipchart reviews bar graphs, how to create them and read them. Excellent activity to get your students involved in a tasty math activity!
The Franklin Institute
Frankin Institute Online: Group Graphing
This site from The Franklin Institute explores how to make a simple graph using a spreadsheet to portray survey data. It also gives a set of interesting sports-related web sites so that students can get statistical inforamtion.
University of Texas
Inside Mathematics: Parking Cars [Pdf]
This task challenges a student to use their understanding of scale to read and interpret data in a bar graph.
ClassFlow
Class Flow: Let's Graph It!
[Free Registration/Login Required] This flipchart has a week of mini lessons where students create bar graphs and pictographs. Students will collect data using tally marks and analyze graphs with discussion questions. Activotes are used...
Rice University
Rice University: Cynthia Lanius: Let's Graph
An introduction to bar graphs, both vertical and horizontal in nature. The interactive aspect of this site allows students to change the values of the data - their favorite cafeteria foods - and then see how the graph is changed.
Math Is Fun
Math Is Fun: Data Graphs
Create and customize a bar graph, line graph, or pie chart based on a set of data and print it out.
Better Lesson
Better Lesson: Graphing Meaningful Data
Students use their timed test scores to create a bar graph that compares their progress in learning math facts.
Texas Instruments
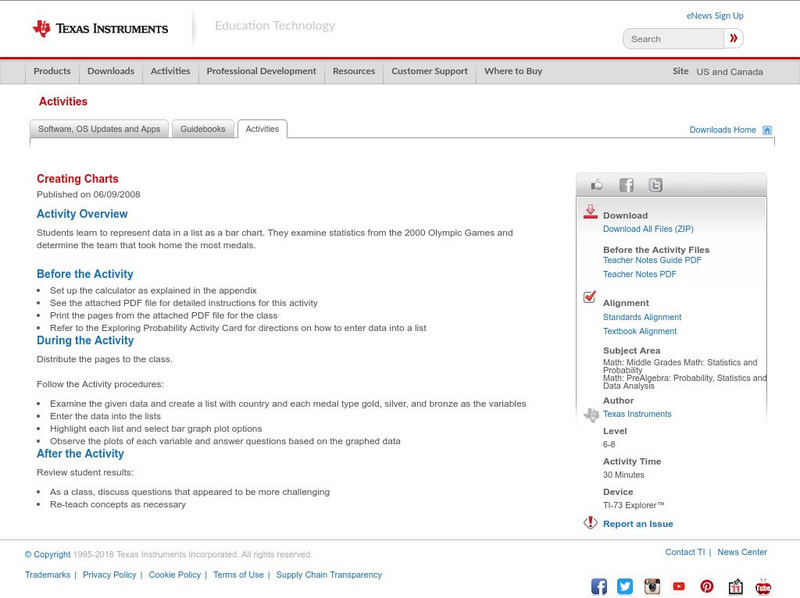
Texas Instruments: Creating Charts
Students learn to represent data in a list as a bar chart. They examine statistics from the 2000 Olympic Games and determine the team that took home the most medals.
Better Lesson
Better Lesson: Class Surveys and Graphs
Learners love graphing data that they "own". In this plan, the class will select a type of graph and create it using a class survey frequency table. Included in this activity are videos of the class engaged in the activity and samples of...
Alabama Learning Exchange
Alex: Great Golly Graphs
This lesson plan asks learners to create a survey project including graphs, questions, tables, and data analysis. It gives an assessment and ideas for remediation and extension as well as ways to manage behavior problems and reluctant...
Alabama Learning Exchange
Alex: What's in a Name: Graphing Lesson
A lesson that teaches students how to create and analyze a graph using the letters of their name. The lesson uses the book Chrysanthemum by Kevin Henkes (not included in the lesson plan) to start the discussion.
ClassFlow
Class Flow: Thanksgiving Graphing
[Free Registration/Login Required] Students will interpret data from a bar graph and a pictograph. They will then create one of each on the Activboard. This flipchart includes links to websites and an Activote quiz.
ABCya
Ab Cya: Fuzz Bugs Patterns
Creating and interpreting a bar graph has never been so much fun! In this educational game kids will create a bar graph by sorting the Fuzz Bugs. Patterns start off easy and get progressively more difficult.
PBS
Pbs: The Lowdown: Exploring Changing Obesity Rates Through Ratios and Graphs
In these KQED Lowdown infographics, explore how adult obesity rates in the United States, as measured by body mass index (BMI), have dramatically changed in the past half-century. A circular graph and a pictograph depict data by decade,...
TeachEngineering
Teach Engineering: A Tasty Experiment
Students conduct an experiment to determine whether or not the sense of smell is important to being able to recognize foods by taste. They do this by attempting to identify several different foods that have similar textures. For some of...
Scholastic
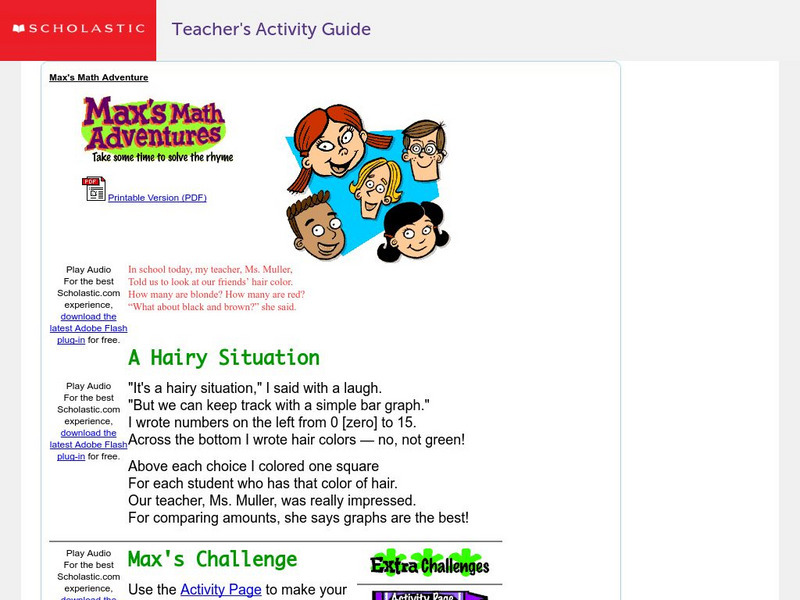
Scholastic: Max's Math Adventures: A Hairy Situation
Help Max make a bar graph to show the hair colors of his classmates. Teachers will appreciate the activities with bar graphs in the extra challenges. Use the teacher's guide to create a fun and engaging lesson.
Alabama Learning Exchange
Alex: Get on Your Mark, Get Set, Go!
In collaborative/cooperative groups, students will review basic vocabulary and concepts for data and statistics. Students will create, collect, display, and interpret data in the form of frequency tables, bar graphs and circle graphs.
Alabama Learning Exchange
Alex: You Scream, I Scream, We All Scream for Ice Cream !
Fun and yummy lesson to do on a sunny spring afternoon. Have the students take a poll of their favorite choice of ice cream and create a bar graph showing the information. This lesson plan was created as a result of the Girls Engaged in...
Khan Academy
Khan Academy: Make Line Plots
Practice creating line plots (dot plots) from data sets. Students receive immediate feedback and have the opportunity to try questions repeatedly, watch a tutorial video, or receive hints.
That Quiz
That Quiz
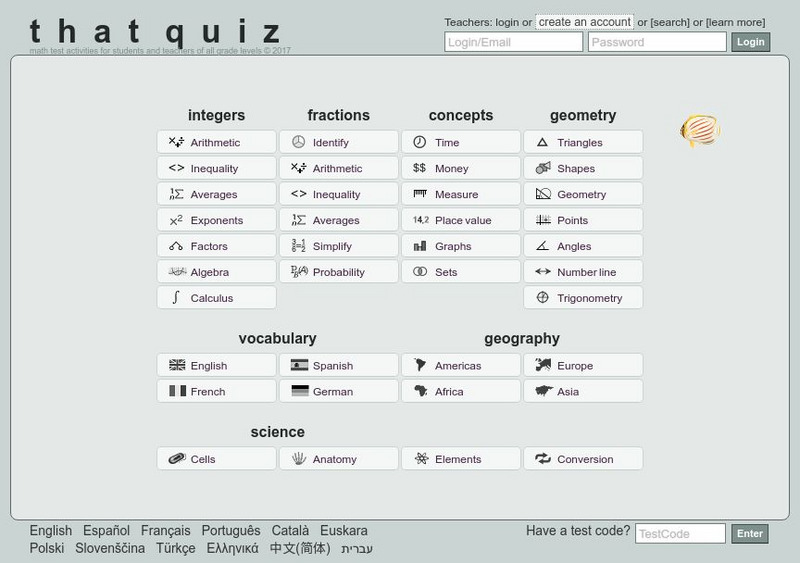
ThatQuiz is an excellent assessment tool for teachers and students. At this site, teachers can create individualized or group assessments on a variety of math topics. Students take these practice assessments directly online and receive...
![Arts Now Learning: We Are Living Graphs and Data [Pdf] Lesson Plan Arts Now Learning: We Are Living Graphs and Data [Pdf] Lesson Plan](https://d15y2dacu3jp90.cloudfront.net/images/attachment_defaults/resource/large/FPO-knovation.png)


