Curated OER
Exercising the Franchise! The Right to Vote
Students research Canadian election procedures, identify candidates and corresponding political platforms for current elections and hold mock elections. They develop a written report about a specific political party.
Curated OER
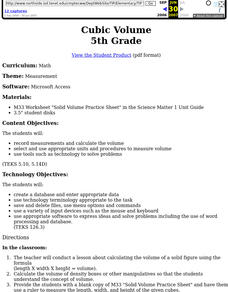
Cubic Volume
Fifth graders record measurements and calculate the volume. They select and use appropriate units and procedures to measure volume # use tools such as technology to solve problems
Curated OER
Fun With Graphs
First graders read about making graphs and lean how to make graphs using "The Graph Club" software.
Curated OER
The Diary of Anne Frank: Research Project on Concentration Camps during World War II
Eighth graders investigate the Holocaust and the persecution of specific ethnic groups in Europe during World War II.
Curated OER
Study of an Artist
Fourth graders research an artist, write a short report and do an oral presentation.
Curated OER
Lewis and Clark Encounters with Native Americans
Students research what the exchange was between the various Native American groups and Lewis and Clark. They are able to write reflections after truly considering the issue with the help of research.
Curated OER
Saving An Endangered Species
Second graders work in groups in order to look at specific internet sites for animal adoption and sponsorship. They select an endangered species, determine needed funds, develop, advertise, and carry out a fund-raising plan.
Curated OER
Polluted Soil
Pupils take plants of their own choice and pollute the soil with a pollutant of their own choice or one assigned by the teacher. They regularly record observations such as plant growth, health, and soil pH.
Curated OER
Metal Composition & the U.S. Mint
Learners study the meaning, symbolism, and value of U.S. coins,
especially the quarter. Theyresearch why in 1965 the U.S. Mint decided to
change the metal composition of the quarter to copper coated with nickel.
In addition, they perform...
Curated OER
Grow Your Own Grub
Students study plant needs and growth by completing a gardening activity. In this plant study lesson, students watch a video and discuss plant growth needs. Students plant seeds in containers and water the plants. Students take photos of...
Curated OER
Dino Hunt
Students use the Internet to gather information about dinosaurs. They practice navagating through the different websites. They also practice listening to directions and also explore how to fill out a KWL chart.
Center for Innovation in Engineering and Science Education, Stevens Institute of Technology
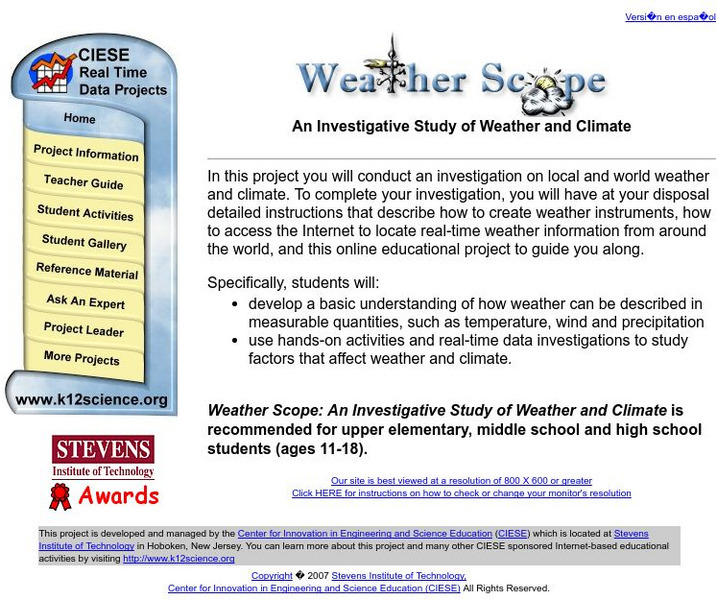
Ciese Real Time Data Projects: Weather Scope: A Study of Weather and Climate
Use real-time data to study factors that affect weather and climate, create weather instruments, and share data with students around the world.
Science Education Resource Center at Carleton College
Serc: Mn Step: Statistical Analysis of Lincoln
For this activity, students first work in groups to collect information about a set of pennies. They measure and record the mass for each one in a table using a spreadsheet program if possible. They also record its year and, for 1982...
University of Texas
Inside Mathematics: Parking Cars [Pdf]
This task challenges a student to use their understanding of scale to read and interpret data in a bar graph.
Google
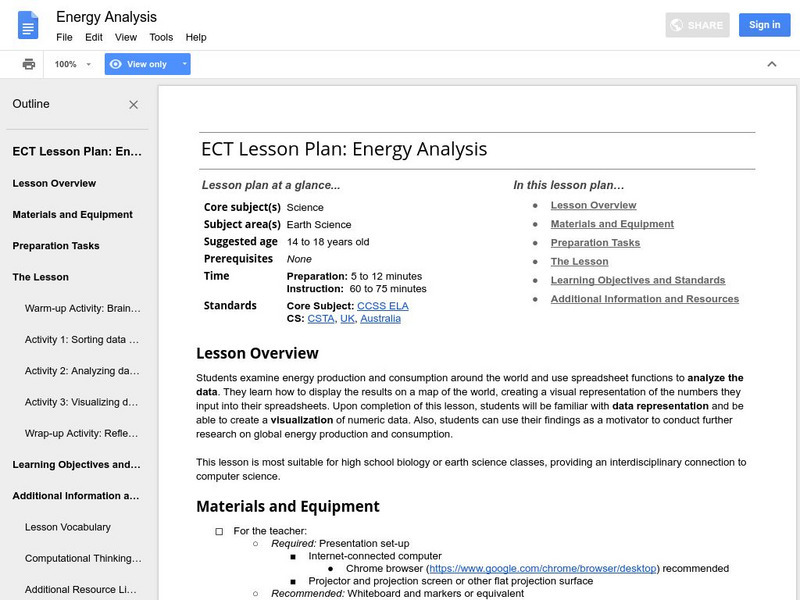
Google for Education: Energy Analysis
Young scholars collect data on energy production and consumption around the world. They input the data into a spreadsheet and use spreadsheet functions to analyze it. Finally, they upload the data into a fusion table to create a...
Other
Nearpod: Displaying Data: Dot Plots
In this lesson, students will learn how to create and intrepret dot plots.
Other
Laus Dnet: Grade 5 Excel Lesson Plan
In this online instructional activity, students will survey students in their school to determine their favorite type of hand-held ice cream. Before performing the survey, students will make predictions about which ice creams they think...
Scholastic
Scholastic: Bars, Lines, and Pies
Middle schoolers will learn and reinforce skills for creating, applying and analyzing pie charts, bar graphs and line graphs.
Better Lesson
Better Lesson: Going for the Gold
Second graders read and create graphs based on Olympic data for 2014.
Science Education Resource Center at Carleton College
Serc: Investigating Motion Graphing Speed
In this introduction to motion activity, students will get a personal understanding of speed and acceleration by experiencing it firsthand. Wheeled office chairs or other cart like devices are used to give one student a ride as a fellow...
Alabama Learning Exchange
Alex: Great Golly Graphs
This lesson plan asks learners to create a survey project including graphs, questions, tables, and data analysis. It gives an assessment and ideas for remediation and extension as well as ways to manage behavior problems and reluctant...
Better Lesson
Better Lesson: Class Surveys and Graphs
Learners love graphing data that they "own". In this plan, the class will select a type of graph and create it using a class survey frequency table. Included in this activity are videos of the class engaged in the activity and samples of...
Shodor Education Foundation
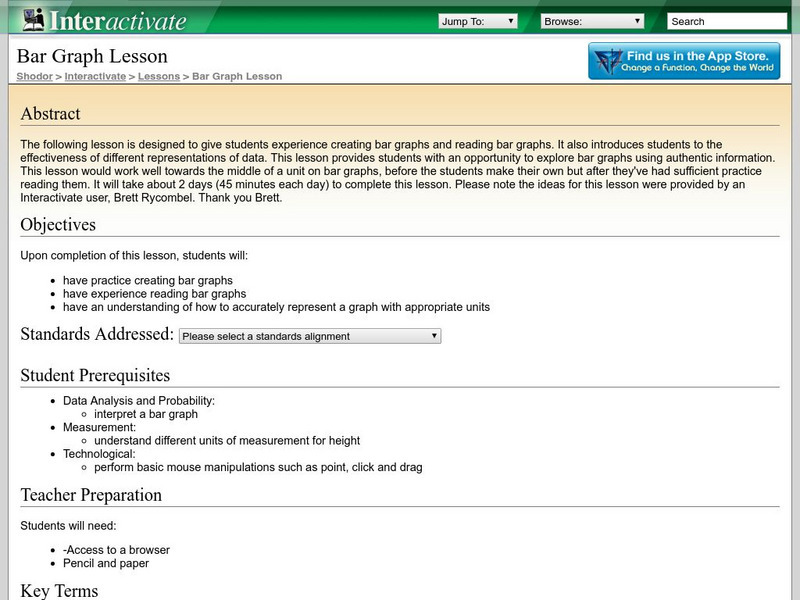
Shodor Interactivate: Lesson: Bar Graph
This lesson is designed to give students practice creating and reading bar graphs as well as understanding how to accurately represent a graph with appropriate units.
Microsoft
Microsoft Education Lesson Plan: Candy Is Dandy
Explore color distribution of M&M candies using this detailed lesson plan. An engaging integrated lesson that requires understanding of spreadsheets and formulas, and logical reasoning. Links to related websites.



![Inside Mathematics: Parking Cars [Pdf] Lesson Plan Inside Mathematics: Parking Cars [Pdf] Lesson Plan](https://d15y2dacu3jp90.cloudfront.net/images/attachment_defaults/resource/large/FPO-knovation.png)
