Curated OER
Probability and Applications of Simulations
Middle schoolers apply properties of probability to the real world. In this probability lesson, learners simulate the construction of empirical distribution. They collect and analyze data using central tendencies.
Curated OER
Project Based Technology in Second Grade
The many activities in this resource serve to introduce second graders to the Macintosh computer and to various programs and their creative product options. They make sideshows using KidPix, practice using email with the Journey South...
Science Education Resource Center at Carleton College
Serc: Investigating Contour Maps: Creating Contour Maps by Surveying
In this activity, the students will understand how contour maps are created and appear the way that they do by using various materials to create and compare contour lines of different elevation levels.
Google
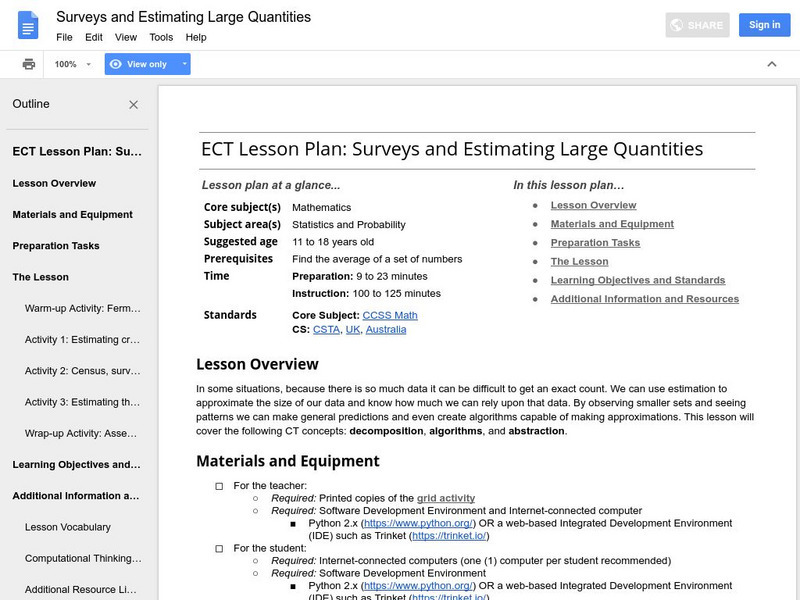
Google for Education: Surveys and Estimating Large Quantities
Young scholars use estimation to approximate the size of a large set of data. By observing smaller sets and seeing patterns they make general predictions and even create algorithms capable of making approximations.
Better Lesson
Better Lesson: Class Surveys and Graphs
Learners love graphing data that they "own". In this plan, the class will select a type of graph and create it using a class survey frequency table. Included in this activity are videos of the class engaged in the activity and samples of...
Better Lesson
Better Lesson: 100 Students Project: Revising Questions & Planning the Survey
How can the wording of a question influence how people respond? Students learn about biased and unbiased questions, revise the questions they create in the previous lesson, and agree on procedures for administering the survey.
Better Lesson
Better Lesson: Survey Skills: Assessment
Today we become Gallup Poll central as students take a set of collected data and create a visual representation using the skills that have been taught over the past few lessons.
Better Lesson
Better Lesson: Hilarious Histograms. Analyzing and Creating
The students will be using real life data to create and analyze histograms. They will be surveying their classmates and using data from other grade levels to compare same topic information in a histogram.
Alabama Learning Exchange
Alex: Great Golly Graphs
This lesson plan asks learners to create a survey project including graphs, questions, tables, and data analysis. It gives an assessment and ideas for remediation and extension as well as ways to manage behavior problems and reluctant...
Other
Laus Dnet: Grade 5 Excel Lesson Plan
In this online instructional activity, students will survey students in their school to determine their favorite type of hand-held ice cream. Before performing the survey, students will make predictions about which ice creams they think...
Other
Brookfield High School: Lesnansky's Control Center: Would You Rather? (Part 2)
In this activity, students will create a customized Google Form that will showcase the four dilemmas defined by the game cards from Would You Rather...? and then share the form with others to collect data for analysis. Lots of Would You...
Alabama Learning Exchange
Alex: Ice Cream Sundae Survey
Learners quickly realize the importance of learning how to read and find information in charts, graphs, and tables compared to finding the same information written in a paragraph. This is a fun, high energy lesson!This lesson plan was...
Indiana University
Indiana University Bloomington: Foldable Fault Blocks [Pdf]
In this lesson, students will create three-dimensional (3-D) blocks out of paper to learn about the types of faulting that occur at the Earth's surface and its interior. Students will manipulate three fault blocks to demonstrate a normal...
Alabama Learning Exchange
Alex: Getting to Know Your Classmates Using Bar Graphs
Middle schoolers will collect data from class using surveys. Students survey classmates concerning favorite movies, favorite color, shoe size, time spent studying, brand of cell phone and etc. From the data they will create bar graphs...
US Census Bureau
Us Census: Percentage of People Who Walk to Work in Cities and Population Size
Using census data, learners will create box plots to make inferences about the percentages of people who walk to work in cities of different population sizes (small, medium, and large). Students will use these findings to write a short...
Council for Economic Education
Econ Ed Link: Who Is Working?
This activity teaches students what economists mean when they talk about people who are employed, unemployed, and not in the labor force. It discusses the Current Population Survey and asks students to pose as government survey workers...
Alabama Learning Exchange
Alex: Away We Go!
Students will survey various classes about the type of transportation that delivers them to school. Students will then combine data and with the help of a teacher create a virtual graph. This lesson plan was created as a result of the...
Alabama Learning Exchange
Alex: Puzzling Pangaea
In this lesson students will work collaboratively to research information in order to prove or disprove if a super continent ever existed. Students will create a model of Pangaea to show how their research findings 'connect' in a puzzle...
Science Education Resource Center at Carleton College
Serc: Creation of Dichotomous Keys From a Bio Blitz
An outdoor lab where students investigate the environment and decide a method of survey to identify trees in their area. To finish the exercise they will create a dichotomous key of the ten they identified.
Alabama Learning Exchange
Alex: The Clock Tower
This project resulted from the collaboration of a computer aided drafting teacher (pre-engineering), Chris Bond, and a math teacher, Lee Cable, (Hewitt-Trussville High School) to provide higher math expectations in CT and real life...
Alabama Learning Exchange
Alex: Let's Make a Pie
The students will survey their classmates and construct circle graphs to display their results. Students will produce circle graphs using a compass and protractor, and then with an interactive computer program.This lesson plan was...


