Curated OER
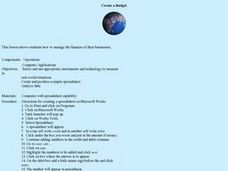
Create a Budget
Learners develop a budget spreadsheet to manage finances for their business. In this finance lesson plan, students use a spreadsheet program to create a budget with credit and debit columns. There are step-by-step directions...
Curated OER
Student News And Weather Channel
Fabulous! Your 5th graders should love this project. As an ongoing lesson throughout the year students use temperature probes to record outside temperature and then document their data using spreadsheets. They use their weather data and...
Curated OER
State Economy Chart
Fifth graders research and record statistics on the economy of an assigned state. They create a spreadsheet in Excel to report the data and a 3D Pie graph using the Chart Wizard in Excel to represent their states' data.
Curated OER
Spreadsheet Budget Project
Eighth graders record all the food they eat for one week, compute the costs for all of this food, and display the different categories on a spreadsheet and then convert to a chart.
Curated OER
What Does George W. Bush Have in Common With Past U.S. Presidents?
Sixth graders discover what it takes to become President of the United States. Using a database, they complete a scavenger hunt to determine what George W. Bush has in common with past Presidents. They also create a spreadsheet which...
Curated OER
Should Voting in the United States be Mandatory? Research Activity
Eighth graders research how many voters actually vote in the U.S. and nine other nations. They create a spreadsheet using this information and write a persuasive essay.
Curated OER
Country Comparisons in Current Events Class
Students collect political, socioeconomic, geographical, and other data about 10 countries and record their data in a spreadsheet. The information is used to fuel current events discussions.
Curated OER
PowerPoint Project for Creating a New Business
Students create a mock new business for which they design a PowerPoint presentation. They include company information, financial statements, graphs, advertising and management promotion pages in the final presentation.
Curated OER
Creating a Newscast on the Cold War
Learners research the events of a specific year of the Cold War. In this Cold War lesson, students investigate the causes of the Cold War and highlight the events of a particular year. Learners create a...
Curated OER
Technology Integration Lesson Plan: Civil War Spreadsheet
Eighth graders discuss and analyze Civil War data, manually graph data on handout, work with partners to enter data into spreadsheets, and create charts on spreadsheet for each data set.
Curated OER
A Line Graph of the Ocean Floor
Learners develop a spreadsheet and import the information into a line graph. In this spreadsheet and line graph instructional activity, students develop a spreadsheet of ocean depths. They import the information into a word processed...
Curated OER
Endangered Species
In this geography worksheet, students identify how to manipulate data on a range of endangered species. They create a bar graph of endangered animals from Africa, Asia, Australia, North America, or South America. Students use a...
Curated OER
BRIDGING THE GENERATION GAP
High schoolers create a hypothesis about the attitudinal differences between generations, test their hypothesis with a survey, chart their findings, and present their answers to the class.
Curated OER
How Much Is It?
Learners explore foreign currencies. In this foreign currencies lesson, students simulate travel to another country and determine the value of the US dollar compared to other countries. Learners use a conversion table and search Internet...
Curated OER
And the Winner Is...
Third graders participate in an election project. They collect data to create a spreadsheet from which a graph is generated.
Curated OER
Super Spreadsheets
Young scholars discover information about each of the fifty states in the United States. In groups, they create a spreadsheet organizing the information to show to the class. They discover different ways to display the data and...
Curated OER
PLANNING A DIVERSIFIED INVESTMENT PORTFOLIO
Twelfth graders research stocks and how to read and interpret financial data. They choose 5 companies to invest in and track their performance over 10 weeks. They create a spreadsheet which shows the results.
Curated OER
What's Alike, What's Different Worksheet
In this occupations worksheet, students create a spreadsheet by answering the 3 short answer questions in order to find similarities and differences among occupations.
Curated OER
Historical Population Changes in the US
Students conduct research on historical population changes in the U.S. They conduct Internet research on the Historical Census Data Browser, create a bar graph and data table using a spreadsheet program, and display and interpret their...
Curated OER
All The Bell & Whistles
Young adults are so eager to get that first cell phone. And, cell phones have so many cool extras! Learners conduct real-life research to determine which cell phone carrier offers the best deals on things like wall paper, ringtones, and...
Curated OER
How Tolerant Are Kids in Your School?
Students graph results of a survey about attitudes and tolerance in their school. They discuss the social climate of their school. Students complete a questionnaire, and tabulate the raw data from their class. They create a bar graph...
Yummy Math
Parametric Equations and a Heart
Trigonometry, art, and Valentine's Day come together in a creative activity about parametric equations. Learners calculate several equations before graphing them either by hand, on a graphic calculator, or Excel spreadsheet to curve...
Museum of Tolerance
Why is This True?
Are wages based on race? On gender? Class members research wages for workers according to race and gender, create graphs and charts of their data, and compute differences by percentages. They then share their findings with adults and...
Curated OER
Introduction to Spreadsheets
Sixth graders utilize Excel or other spreadsheet software to create both text and numerical valued columns to produce a Christmas or birthday wish list. They study the difference between text and numerical values for column use and...


