Hi, what do you want to do?
Beacon Learning Center
Beacon Learning Center: Interpreting Line Graphs
This site is a lesson on creating and interpreting a line graph. It explains how a line graph is created and then asks questions about what is learned from the data. Students type in open responses, and answers and feedback follow.
CK-12 Foundation
Ck 12: Statistics: Broken Line Graphs
[Free Registration/Login may be required to access all resource tools.] Covers creating and interpreting broken-line graphs.
CK-12 Foundation
Ck 12: Statistics: Line Graphs to Display Data Over Time
[Free Registration/Login may be required to access all resource tools.] Create line graphs to display how data changes over time.
US Department of Education
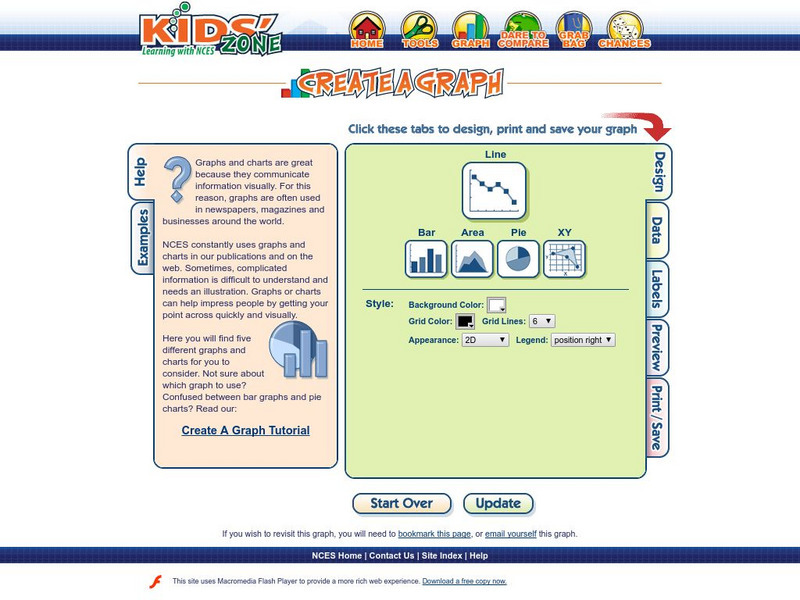
Nces: Create a Graph: Kids Zone
Make your own pie, bar, line, area or XY graph with this interactive tool. Look for examples of graphs already created from data collected by the National Center for Education Statistics. Complete with a graphing tutorial.
US Department of Education
Nces: Create a Graph: Line Graph
This resource from the National Center for Education Statistics provides tools for creating line graphs right online! Select a type of graph, fill in the information, and voila! -- you have created a wonderful graph all your own!
Math Is Fun
Math Is Fun: Data Graphs
Create and customize a bar graph, line graph, or pie chart based on a set of data and print it out.
Khan Academy
Khan Academy: Make Bar Graphs 1
Practice creating bar graphs (bar charts) from data sets. Students receive immediate feedback and have the opportunity to try questions repeatedly, watch a video or receive hints.
Khan Academy
Khan Academy: Graph Data on Line Plots
Record measurements on line plots (also called dot plots). Students receive immediate feedback and have the opportunity to try questions repeatedly, watch a video or receive hints.
US Department of Education
Nces Kids: Creating an Area Graph
This is where you will find step by step directions explaining how to create an area graph. Complete each step and click on the next tab. Directions are simple and clear.
Concord Consortium
Concord Consortium: Stem Resources: Building a Zip Line
For this interactive, students plan, create, and test a zip line that will transport a hard-boiled egg without breaking it. They will make improvements on their design based on data about its performance. A motion sensor is required in...
Alabama Learning Exchange
Alex: "Ridin' Along in My Automobile"
Students will research prices of used cars to discover how automobiles lose their value over time. Students will create a chart to record their information, use their chart to graph their data, and find measures of central tendency of...
University of Colorado
University of Colorado: Ph Et Interactive Simulations: Least Squares Regression
Create your own scatter plot or use real-world data and try to fit a line to it. Explore how individual data points affect the correlation coefficient and best-fit line.
University of South Florida
Fcat: Human Number Line: Teacher Notes
This activity allows students to physically create a number line and work on adding and subtracting integers. This lesson can be adapted to include other concepts with real numbers.
Colorado State University
Colorado State Writing Center: Charts
The use of charts and graphs can improve your presentations, whether on paper or as visual aids. Here you can read about how to create line, column, bar, pie graphs, and scatterplots. Just follow the links to their respective pages.
Texas Instruments
Texas Instruments: Mc Dougal Littell Middle School Math: Making Data Displays
Students will create data displays using a scatter plot and a line graph of the data and a circle graph of survey data.
PBS
Pbs Learning Media: Decreasing Water Levels
The CyberSquad creates a line graph to help tell the story of the decreasing water levels in Sensible Flats in this video segment from Cyberchase.
Texas Instruments
Texas Instruments: Key Curriculum Press Algebra: Project the Mandelbrot Set
Students will choose a small region on the boundary of the Mandelbrot Set and create a graph of that smaller region.
Other
Nearpod: Linear Equations & Graphs
In this lesson on linear equations and graphs, young scholars will learn how to graph linear equations and create linear equations based upon real-life word problems.
Khan Academy
Khan Academy: Plotting Inequalities
Create number line graphs of inequalities. Students receive immediate feedback and have the opportunity to try questions repeatedly, watch a video or receive hints.
Khan Academy
Khan Academy: Creating Dot Plots
Practice creating dot plots. Dot plots are very similar to frequency tables, but they make it easier to see the data. Students receive immediate feedback and have the opportunity to try questions repeatedly, watch a video or receive hints.
Houghton Mifflin Harcourt
Houghton Mifflin Harcourt: Saxon Activity Center: Real World Investigation: Elevation Changes [Pdf]
Math and geography are the focus of this internet investigation. Learners must plan a road trip to several cities and plot the elevations of those cities using a line graph. Acrobat Reader required.
That Quiz
That Quiz
ThatQuiz is an excellent assessment tool for teachers and students. At this site, teachers can create individualized or group assessments on a variety of math topics. Students take these practice assessments directly online and receive...
Texas Instruments
Texas Instruments: Linear Regression: Wing Span/height
Students take measurements of individual's wing span and height and create a coordinate graph. The activity should include at least three different grade levels. Students submit an equation through "Activity Center" and the class...


