Curated OER
Using Tables to Solve Linear Functions
Oh that intercept! Budding algebra masters solve linear equations from standard to intercept form. They identify the slope and y-intercept to help graph the lines, an then create coordinate pairs using a table of values. Great TI tips...
Curated OER
Using Graphs to Compare
Pupils use the FoilSim computer simulation program, and demonstrate an understanding of the lift variables by explaining their graphical representations. They demonstrate an understanding of forces and motion.
Curated OER
Standard Linear Form
Ninth graders identify and describe the x-intercept as the place where the line crosses the x-axis as it applies to football. They create their own differentiations to reinforce the distinction between the x-intercept and the...
Curated OER
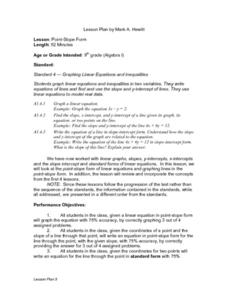
Point-Slope Form
Ninth graders explore the point-slope form of linear equations and graph lines in the point-slope form. After completing the point-slope equation, they identify the slope of a line through a particular point. Students explain the...
Curated OER
The Proof
Students will construct simple curves on graph paper by connecting a series of points between the vertical and horizontal axes. They share their designs and explain the patterns.
Curated OER
Rocketsmania And Slope
Students use a professional basketball team's data and graph it on a coordinate plane. They draw a line of regression and finding its equation. They access a website containing statistics for the Houston Rockets basketball team to solve...
Curated OER
Snow Cover By Latitude
Students create graphs comparing the amount of snow cover along selected latitudes using data sets from a NASA website. They create a spreadsheet and a bar graph on the computer, and analyze the data.
Curated OER
A Point of Intersection
Students factor and solve systems of equation. For this algebra lesson, students identify the point of intersection using substitution, elimination and graphing. They write an equation given a system and a graph.
Curated OER
Linear and Nonlinear Functions
Students identify properties of a line. In this algebra lesson, students differentiate between functions and nonfunctions. They use the slope and y intercept to graph their lines.
Curated OER
Baseball - America's Pastime
Students complete Internet research about baseball and baseball players. They complete a variety of activities including writing an epitaph for Jackie Robinson, a news article about him, and make graphs displaying salaries of a number of...
Curated OER
Points of Intersection
Students solve systems of equations. In this solving systems of equations instructional activity, students look for the intersection of the two lines in the system. Students solve systems that have one solution, no solution,...
Curated OER
Understanding Topographic Maps
Students are introduced to the characteristics and uses of topographical maps. Using a worksheet, they examine the use of specific terminology and use cutouts to create their own topographical map of an area. They answer discussion...
Curated OER
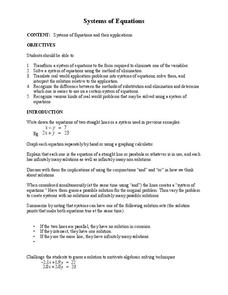
Systems of Equations
Students solve systems of equations. In this algebra activity, students use elimination and substitution to solve for the point of intersection. They use graphing to see where the two lines intersect.
Curated OER
What's The Point?
Students solve word problems using the correct math symbols. For this algebra lesson, students use the TI calculator to graph their equation and analyze it. They find the line of regression and use to draw conclusion.
Curated OER
Discovering the Linear Relationship between Celsius and Fahrenheit
Learners discover the linear relationship between degrees Farenheit and degrees Celsius. They manually compute the slope and y-intercept of the line passing through points. They convert Celsius to Fahrenheit degrees.
Curated OER
From Playing with Electronics to Data Analysis
Students collect and Analyze data. In this statistics instructional activity, students identify the line of best fit of the graph. They classify lines as having positive, negative and no correlation.
Curated OER
The Distributive Property
Students solve problems using the distributive property. In this algebra lesson, students solve equations by multiplication and combining like terms. They graph their lines on the calculator.
Curated OER
Correlate This!
Learners investigate different correlations. In this algebra lesson, students analyze graphs and identify the lines as having positive, negative or no correlation. They calculate the line of best fit using a scatter plot.
Curated OER
It's a Drag!
Students create number lines using decimals and whole numbers. In this algebra lesson, students graph and solve linear equations. They plot ordered pairs on a coordinate plane correctly.
Curated OER
Menu Math
Learners follow the food pyramid to create a daily food budget. They research food prices online or in newspapers. They graph the amount of each food group included in their menus. They can also create a weekly food menu based on a fixed...
Curated OER
Particle Motion 2
Young scholars analyze the motion of a particle along a straight line. In this precalculus lesson, students use the TI to analyze the position of a function as they graph and visualise the function. They calculate the distance and...
Curated OER
Choosing a Summer Job
What did you do over your summer vacation. Young wage earners must compare summer job options, and determine when each job earn the same amount and what that amount be. This be done by creating, graphing, and solving systems of...
Curated OER
Linear Patterns in Data
Eighth graders extend their learning of graphing linear equations and are introduced to connecting patterns in tables and graphs to represent algebraic representations. They then determine patterns and extrapolate information from these...
Curated OER
Sonar Mapping
Students use a shoe box to create a seafloor model and use cardboard for layering inside of the shoe box to simulate the ocean floor. They probe the ocean floor to simulate sonar echoes. Finally, students graph their data to get a...


