Curated OER
Excel temperature Graphs
Students gather data about the weather in Nome, Alaska. In this Nome Temperature lesson, students create an excel graph to explore the weather trends in Nome. Students will find the average weather and add a trend line to their graph.
Curated OER
An Introduction To Solving And Graphing Inequalities
Students graph inequalities and solve the equations. In this algebra lesson, students graph their solutions on a number line and create an inequality for a word problem.
Curated OER
Graphing Using Excel
Fifth graders complete a series of graphs by gathering information and using Excel to graph the information. For this graphing lesson, 5th graders graph favorite desserts of the class. Student put their results into the...
Curated OER
Skittle Math
In this skittle math worksheet, young scholars sort skittles by color and create a bar graph for each color of skittle. Students also answer comparison, ratio, and relationship questions about the skittles.
Curated OER
Shell Graphing
Fifth graders explore the four quadrants of a coordinate grid. For this graphing lesson, 5th graders trace sea shells in each of the four quadrants of a coordinate grid and then label the ordered pairs on each shell. For the...
Curated OER
Graphing Surveys and Analyzing Data
Students analyze data and graph the results of their surveys. In this statistics lesson plan, students create graphs using excel to make graphs to be able to better observe their data. They conclude how great we as unique individuals.
Curated OER
Graphing Pasta
Students sort and graph various types of pasta. Using pasta construction paper patterns or real pasta, they sort the pasta by color, size, and type, and record the data on a graph.
Alabama Learning Exchange
Technology for Displaying Trigonometric Graph Behavior: Sine and Cosine
Students explore the concept of sine and cosine. In this sine and cosine instructional activity, students work in groups to graph sine and cosine functions. Students examine how coefficients in various parts of each parent...
Curated OER
Graphing Linear Equations
Ninth graders review the information that they have already learned
with regard to linear equations and graphical representations. They then assist in combining equations with a graphical element and complete various graphs with this...
Curated OER
Bar Graphs
Students perform operations and graph their data using charts and bar graphs. In this algebra lesson, students follow specific steps to make a bar graph. They create a survey about people favorite things and plot their data from the...
Curated OER
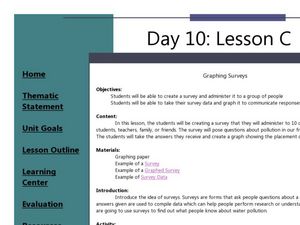
Graphing Surveys
Learners collect data and graph it. In this algebra lesson, students create a survey for their classmates and teachers. They analyze the results from the survey and graph it. They draw conclusion from their data based on the graph.
Curated OER
How Has Math Evolved?
Eighth graders pick a topic or person to research related to the history of mathematics. They brainstorm and create a concept map, using the multimedia software inspiration, about what they are researching and want to examine. They then...
Curated OER
Graphing Quadratic Functions
In this graphing quadratic functions worksheet, students create a function table and graph quadratic functions. This four-page worksheet contains 33 problems. A graph is supplied with each function. One example is provided at the...
Curated OER
Bar Graphs and Pie Charts
Young scholars graph data they collected and analyze it using a bar graph. In this algebra lesson, students analyze their data using pie charts and bar graphs while explaining the meaning to each other. They compare and contrast bar...
Curated OER
Surveys and Graphing
First graders survey different classrooms to determine types of products students would like to see sold at school, and create graphs based on survey results.
Curated OER
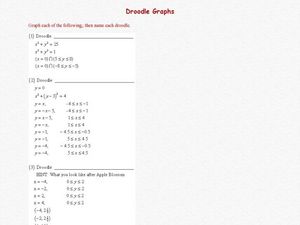
Droodle Graphs
In this algebra worksheet, students graph piecewise functions, and circles using restrictions. They graph a line and chop it on both ends to create a stair case looking graph or a ladder. There are 3 involve questions with an answer key.
Curated OER
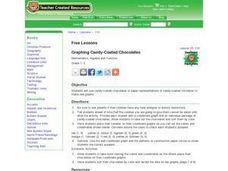
Graphing Candy-Coated Chocolates
Students place pieces of candy on their coordinate graphs as the teacher calls out the colors and coordinates embedded in the plan. The teacher circulates around the class to check each student's answers for accuracy.
Curated OER
Math Regents Exam Questions: Lesson 1-6 - Mean, Median, Mode and Range
In this mean and median activity, students examine given data and determine the measures of central tendency for the data. Students compute the mode, mean, median, and range of data. They create stem-and-leaf plots. ...
Curated OER
Mixing Mixed Numbers Art/Creating Fractions
Third graders explore number values by participating in class math activities. In this fractions lesson plan, 3rd graders collaborate with classmates to discuss the technique of adding mix numbers while utilizing paper plates to help...
Alabama Learning Exchange
Creating a Reflection
Investigate geometric reflections in this geometry lesson. Create geometric reflections that show the reflection across the x and y axis of a coordinate graph. Learners watch a teacher demonstration before proceeding on their own. They...
Curated OER
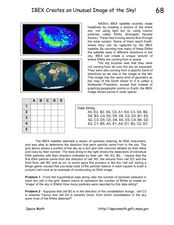
IBEX Creates an Unusual Image of the Sky!
In this IBEX satellite worksheet, learners read about the Energetic Neutral Atoms that are detected by the IBEX satellite. Students use a given hypothetical data string to determine the number of particles detected and create an 'image'...
Curated OER
Simple Bar Graphs Using Excel
Students create original survey questions, and develop a bar graph of the data on paper. They input the survey data using two variables onto an Excel bar graph spreadsheet.
Curated OER
Bar Graph Lesson
Students make a bar graph. In this graphing lesson, students discuss why bar graphs are used and are shown bar graph examples. Students create their own bar graph to compare the heights of different things around the world. Students...
Curated OER
The Circle Graph
In this circle graph worksheet, students complete problems involving many circle graphs including a compass rose, degrees, and more. Students complete 7 activities.


