Curated OER
Graphing in the Information Age
Middle schoolers create a variety of graphs based on population data. In this statistics lesson plan, students use data that can be gathered on-line to make a bar chart, line graph, and circle graph.
Curated OER
Graphing Fun In Third Grade
Third graders display information in a graph, table, and chart. In this data lesson plan, 3rd graders look at graphs, tables, and charts, discuss their importance, and make their own.
Curated OER
Using Spreadsheets and Graphs
Third graders explore mathematics by utilizing computers. In this graphing lesson, 3rd graders gather class data based on a particular topic such as the "favorite candy" of the class. Students utilize this information and computers to...
Curated OER
Graph Groups
For this graphing worksheet, 3rd graders create their own bar graphs. students study the pictures shown and complete 5 graphs beside each picture.
Curated OER
Making A Horizontal Bar Graph
In this bar graph learning exercise, students create a bar graph to display 6 scores from basketball games. Students will label the x and y axis and correctly plot the scores from the table provided.
Curated OER
Bar Graph- Calories In Fast Food Items
In this bar graph worksheet, students analyze a bar graph that shows calories in 10 fast food menu items. Students answer 7 questions about the graph.
Curated OER
Integrating Math and Sports Project
Students work in pairs to choose a set data from one of the sports websites for their chosen sports. They find the mean, median, mode, and range of their data set. Students create a graph on Microsoft Excel and write several...
Curated OER
Seasonal Graphs
In this math worksheet, students create a graph using the data recorded from the local newspaper concerning local temperatures.
Curated OER
Bunny Mix M&M's Math
In this Easter M&M's math activity worksheet, students count their M&M's, sort them by color, make a pattern with them, and create a graph showing how many of each color they have.
Curated OER
This is the Way We Go To School
Second graders create and utilize a graph using the Excel computer program. They gather data regarding how the students get to school, tally the numbers for the class, and create a bar graph on paper and using Excel.
Curated OER
Counting
First graders explore collecting data. They collect data using a data collection sheet and enter the data into Excel. Students create graphs using Excel. They share their graphs with the class.
Curated OER
Perplexing Puzzles
Elementary and middle schoolers explore scatter plots. In this graphing lesson, pupils work in small groups and use jigsaw puzzles to develop a scatter plot. Younger young scholars may develop a bar graph.
Curated OER
What's Data?
Students get the opportunity to investigate the concept of data collecting. They explore how to tally and read a bar graph. Vocabulary about data is also be included. At the end of the lesson, individual students collect data independently.
Virginia Department of Education
Solving Linear Equations
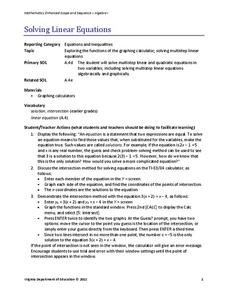
Practice solving linear equations by graphing. Scholars learn to solve multi-step linear equations in one variable by graphing both sides of the equation separately. They use graphing calculators to find the intersection of the graphs.
Curated OER
Time Management
Students record their daily activities and graph the results using the educational software program called Inspiration. This lesson plan is intended for the upper-elementary classroom and includes resource links and activity extensions.
Curated OER
Probability Fun
What are the chances? Probability comes into play in this worksheet as mathematicians examine a circular chart with images, determining the possibility that the "spinner" will land on each of the images. Appropriate for younger...
Curated OER
Creating Bar Graphs and Pie Graphs
Second graders observe a demonstration of the creation of a bar graph and a pie graph of their favorite colors. They gather information about various topics from their classmates, then organize the information, creating a bar and a pie...
Curated OER
Creating Bar Graphs
Fifth graders design and label a bar graph using data taken from a class survey. They observe a teacher-led lecture, write and conduct their survey, and create a bar graph that includes identification of the minimum, maximum, mode,...
Curated OER
Data Analysis
For this data analysis worksheet, learners solve and complete 6 different problems that include using various types of data analysis. First, they create a stem-and-leaf plot of the ratios shown at the top and determine the mean, median,...
Curated OER
All About Me
Students use a digital camera to take pictures of various faces. They then sort pictures according to eye color and create a graph. Students draw pictures of themselves on the screen using specified tools and colors. They choose hair...
Curated OER
Data Analysis Challenge
In this data analysis worksheet, young scholars work with a partner to collect information for a survey. The information is then compiled into a graph. Students must indicate their survey question, the target audience, predict the...
EngageNY
The Graph of a Function
Mathematics set notation can be represented through a computer program loop. Making the connection to a computer program loop helps pupils see the process that set notation describes. The activity allows for different types domain and...
National Research Center for Career and Technical Education
Break-Even Point
How do companies determine the prices of their products? Marketing maestros discover the concepts of cost and break-even point through discussion, independent practice, and a collaborative assessment. The career and technology-oriented...
Mascil Project
House Insulation
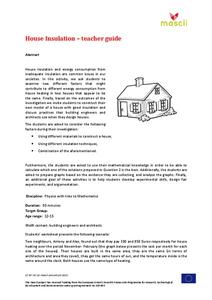
Make sure your house is warm in the winter. Pupils analyze graphs of heating costs for two similar houses and make hypotheses for why the costs differ. They then build models of houses with appropriate insulation to reduce heating costs.


