Other
National Security Agency: Line Plots: Frogs in Flight [Pdf]
Students learn how to construct and interpret line plots. The lesson plan describes an activity that has students collect data, create line plots, and interpret and analyze the data.
US Department of Education
National Center for Education Statistics: Create a Graph Tutorial
This tutorial walks students through how to create different types of graphs using the Create a Graph tool available on the website. Covers bar graphs, line graphs, pie charts, area graphs, scatter plots, and dependent and independent...
TeachEngineering
Teach Engineering: Cooking With the Sun Creating a Solar Oven
For this activity, students will be given a set of materials: cardboard, a set of insulating materials (i.e. foam, newspaper, etc.), aluminum foil, and Plexiglas. Students will then become engineers in building a solar oven from the...
Other
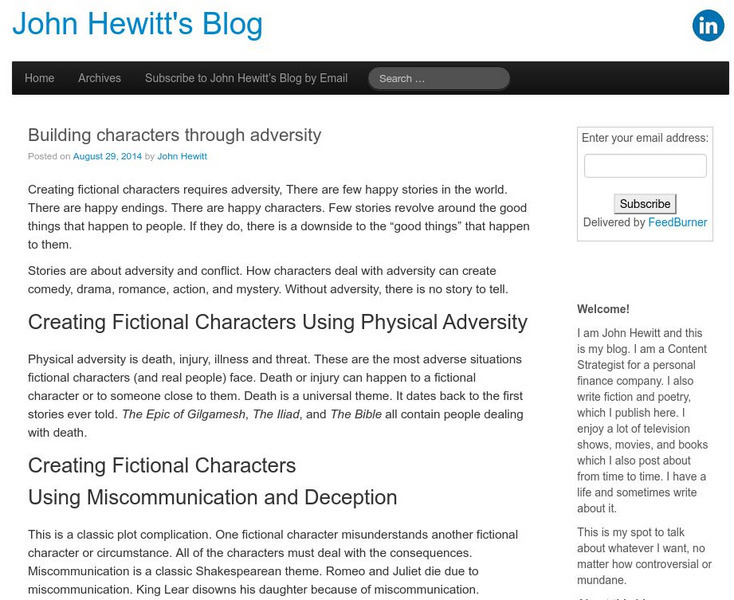
Building Characters With Adversity
Extensive and very interesting article advising the reader on how to develop characters through adversity.
Alabama Learning Exchange
Alex: My Peanut Butter Is Better Than Yours!
The students will engage in the process of statistical data comparing data using tables and scatterplots. The students will compare data using measures of center (mean and median) and measures of spread (range). This lesson can be done...
Illustrative Mathematics
Illustrative Mathematics: 2.md the Longest Walk
In this lesson plan students will measure different points on the map and create a line plot from those measurements.
Alabama Learning Exchange
Alex: Connecting With Coordinates
This lesson will allow students to practice plotting points on a grid. Students will have an opportunity to play a coordinate game. This lesson is hands-on and allows for cooperative learning. This lesson plan was created as a result of...
Texas Instruments
Texas Instruments: Defining the Parabola
The teacher will graph a horizontal line and plot a point using TI-Navigator, and the class will provide the points that create a parabola.
Caro Clarke
Caro Clarke: What Is Conflict?
This is the sixth in a series of articles designed to help the new writer with their novel. This article focuses on conflict and how it effects the characters and the plot of the story. W.11-12.3a Narratives
Other
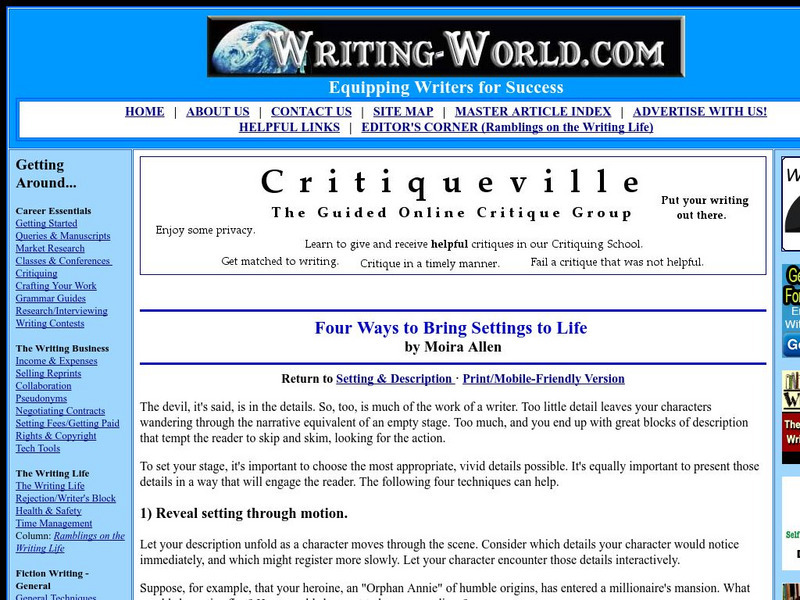
Writing World: Four Ways to Bring Settings to Life
A great resource outlining four major ways to make settings appear more real and genuine in fiction. Deals with themes such as motion, experience, mood, and the senses. W.11-12.3d Sensory/precise lang narratives
PBS
Pbs Teachers: Story Writing With Arthur
This series of 12 downloadable activities teach students some basics of story writing, using books or videos from the PBS "Arthur" series as a springboard. Activities include creating story maps, asking questions about characters and...
Alabama Learning Exchange
Alex: Wildlife Math
This integrated lesson is the result of collaboration between Chip Blanton, a wildlife management teacher, and Greg Pendergrass, a math teacher (Ft. Payne High School). Learning to manage wildlife requires an understanding of planting...
Writing Fix
Writing Fix: Short Adventure Stories
Inspired by the interactive plot ideas here, writers will create an original three-paragraph adventure story. First, each writer will create an original adventurer. Next, each writer will place the adventurer in a brief, organized...
Alabama Learning Exchange
Alex: Romeo and Juliet "What If?"
Student groups will be assigned separate acts of Romeo and Juliet where they will read and interpret the original version; then, remake it using a modern spin but keeping the same basic plot, act out their version, and create a...
PBS
Pbs Teachers: Jason and the Golden Fleece
Explore characterization, plot and setting and compare these elements in mythology and modern works of literature, film and television. Retell myths in modern settings or modern-day stories using a mythological Greek setting. While this...
Alabama Learning Exchange
Alex: Using a Fairy Tale to Teach the Elements of a Story
Students will hear and read different versions of a familiar fairy tale and identify what elements a story must have (character, plot, setting) for the story to be interesting and make sense. Using a Venn diagram, students will then...
Better Lesson
Better Lesson: Jumping Into Math, Measurement & Data Day 2
Third graders create line plots and analyze data using measurement data with quarter unit fractions.
The Franklin Institute
Frankin Institute Online: Group Graphing
This site from The Franklin Institute explores how to make a simple graph using a spreadsheet to portray survey data. It also gives a set of interesting sports-related web sites so that students can get statistical inforamtion.
![National Security Agency: Line Plots: Frogs in Flight [Pdf] Lesson Plan National Security Agency: Line Plots: Frogs in Flight [Pdf] Lesson Plan](https://content.lessonplanet.com/knovation/original/122495-587001a487c71ef32e76fdab66ff794e.jpg?1661494304)


