Hi, what do you want to do?






Teach Engineering
Density Column Lab - Part 2
Groups suspend objects within layers of liquids to determine the densities of different liquids and compare them to the densities of objects calculated in Part 1. The groups then carefully test their calculations by layering the...

NOAA
Mapping the Deep-Ocean Floor
How do you create a map of the ocean floor without getting wet? Middle school oceanographers discover the process of bathymetric mapping in the third installment in a five-part series of lessons designed for seventh and eighth graders....

Teach Engineering
Determining Densities
Don't be dense—use a robust resource. The second installment of a five-part Floaters and Sinkers unit has learners determine the densities of several objects. As part of the activity, they learn the displacement method for finding...

Curated OER
Match Me!
Young learners explore motion graphs in this lesson. They investigate distance-time plots as they move in a specific way in front of the CBR in an attempt to make a motion plot that matches a given plot. Pupils explore the connections...

California Academy of Science
Which Way is North?
Who needs a compass to find cardinal directions? Just place a stick in the ground and record the movement of its shadow over the course of a day. Then, measure the shadow lengths in order to determine a north-south line. A simple...

Curated OER
Curve Ball
Create a Height-Time plot of a bouncing ball using a graphing calculator. Graph height as a function of time and identify the vertex form of a quadratic equation that is generated to describe the ball's motion. Finally, answer questions...

Curated OER
Curve Ball
Learners explore the concept of parabolas by collecting quadratic data on a bouncing ball as it is falling using a motion detector. They plot the data and determine the equation of the quadratic in vertex form, then determine the values...

PHET
Energy Skate Park: Basics
Keep calm and half pipe. An exciting simulation teaches pupils about energy transfer from potential to kinetic and thermal as a skater moves through a half pipe or other track. After a brief introduction, scholars can build their own...

Teach Engineering
Energy Perspectives
The data says ... the resource is great to use. Using Microsoft Excel, pupils analyze data from the US Department of Energy in the fifth lesson of a 25-part Energy Systems and Solutions unit. Each group looks at a different data set and...
TeachEngineering
Teach Engineering: Cooking With the Sun Creating a Solar Oven
For this activity, students will be given a set of materials: cardboard, a set of insulating materials (i.e. foam, newspaper, etc.), aluminum foil, and Plexiglas. Students will then become engineers in building a solar oven from the...
Texas Instruments
Texas Instruments: Bouncing Ball
In this activity, students' will create a Height-Time plot for a bouncing ball. They will examine how the ball's height changes mathematically from one bounce to the next.
TeachEngineering
Teach Engineering: Can You Resist This?
This lab demonstrates Ohm's law as students set up simple circuits each composed of a battery, lamp and resistor. Students calculate the current flowing through the circuits they create by solving linear equations. After solving for the...
TeachEngineering
Teach Engineering: Runaway Train: Investigating Speed With Photo Gates
Students conduct an experiment to determine the relationship between the speed of a wooden toy car at the bottom of an incline and the height at which it is released. They observe how the photogate-based speedometer instrument "clocks"...
Texas Instruments
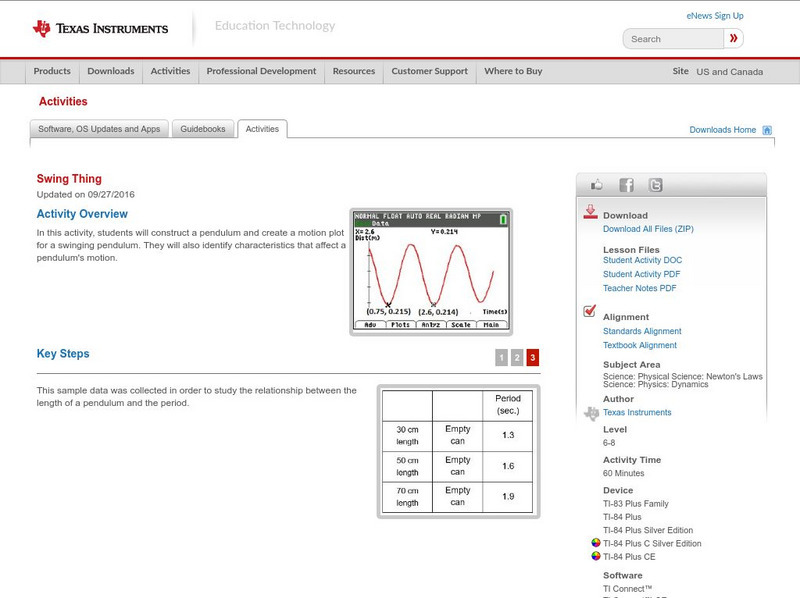
Texas Instruments: Swing Thing
In this activity, students will construct a pendulum and create a motion plot for a swinging pendulum. They will also identify characteristics that affect a pendulum's motion.
Texas Instruments
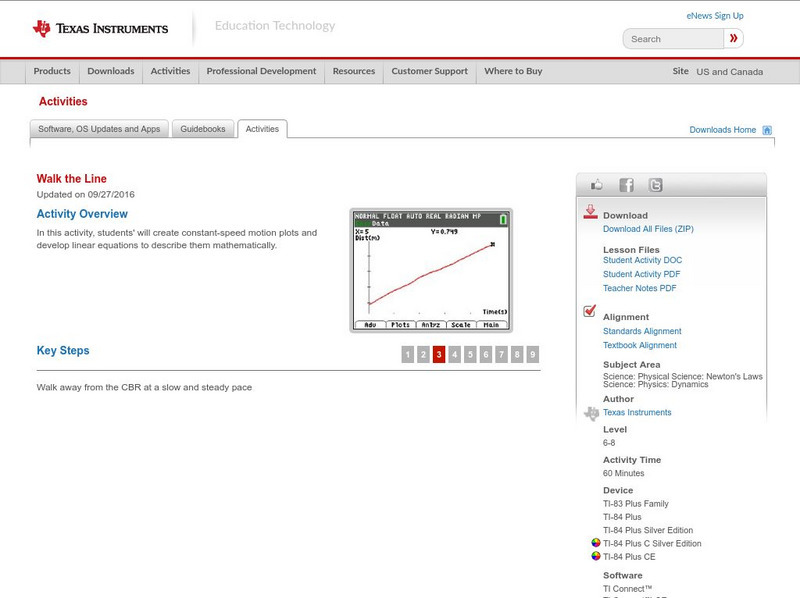
Texas Instruments: Walk the Line
In this activity, students will create constant-speed motion plots and develop linear equations to describe them mathematically.