Curated OER
Absolute Value of Linear Functions
Students discover how abolute value affects linear functions. They complete a worksheet simulating a path for miniature golf hole in one for three figures. They construct a hole in one graph for each hole marking the X and Y coordinates.
Curated OER
Lesson Plan On Fran Data
Seventh graders investigate the concept of functions and how they are used in the context of the real world while identifying the dependent and independent variables. They graph relations and functions and find the zeros of functions....
Curated OER
Calculus Test
For this calculus worksheet, students assess their understanding and knowledge of limits, derivatives, differential equations, and other calculus topics. The one page worksheet contains twenty-eight multiple choice questions. ...
Curated OER
Looking For Triangles
Students solve problems with triangles. In this geometry instructional activity, students analyze shapes to find different triangles. They name the shapes created by putting triangles together.
Curated OER
Curveball vs. Fastball
Students graph the relationship between the release point and the final position of curveballs and fastballs thrown by both right and left handers given a constant speed, and explain the relationships illustrated by the graphs of data.
Curated OER
Altitude and Flight Forces
Students use the World Wide Web to access and use FoilSim. They also use the World Wide Web to access the NASA Glenn Web site for information relative to the factors involved with the flight of an airplane.
Curated OER
Mapping Seamounts in the Gulf of Alaska
Students describe major topographic features on the Patton Seamount, and interpret two-dimensional topographic data. They create three-dimensional models of landforms from two-dimensional topographic data.
Alabama Learning Exchange
The Composition of Seawater
Young scholars explore the concept of finding the composition of seawater. In this finding the composition of seawater instructional activity, students make a saturated salt water solution. Young scholars discuss why there is...
Wolfram Research
Wolfram Math World: Line Integral
Use this site to find the formula for the line vector of a field on a curve. Also included is the formula for complex plane circumstances. Read further down the page for higher math involving involveing Poincare's
Mocomi & Anibrain Digital Technologies
Mocomi: Lines and Angles
Provides details about the properties of straight lines, types of straight lines, line segments, rays, curved lines, and types of angles.
Mathematics Archives
Math Archives: Visual Calculus: Tangent Lines and Parametric Curves
This site provides information on tangent lines and parametric curves. It includes formulas and examples.
Mathematics Archives
Math Archives: Visual Calculus: Tangent Lines
This is a detailed site concerning tangent lines to curves. The site gives the limiting definition of the slope of the tangent. This site has a link to a discussion and animation of the approaching secant line, a java applet for the...
CK-12 Foundation
Ck 12: Elem Math: Counting Straight Lines and Curves in Various Shapes
[Free Registration/Login may be required to access all resource tools.] Students watch a video and attempt practice problems on counting lines and curves in various two dimensional shapes.
Council for Economic Education
Econ Ed Link: Graphing a Lorenz Curve and Calculating the Gini Coefficient
In this lesson, students receive raw data to construct a Lorenz Curve and calculate the Gini Coefficient. This lesson prepares AP Microeconomics students for the Advanced Placement exam. The teacher will briefly interpret the Gini...
Cool Math
Coolmath: More on Tangent Lines
This CoolMath resource provides instruction and practice for tangent lines.
Wikimedia
Wikipedia: Lorenz Curve
This website describes what a Lorenz curve is, and shows what it would look like graphically. A mathematical formula is also given.
Northeast Parallel Architectures Center, Syracuse University
Npac Reu Program: Tangent Lines
The Northeast Parallel Architectures Center at Syracuse University offers a fairly detailed site explaining the slope of a tangent line to a curve.
Texas Instruments
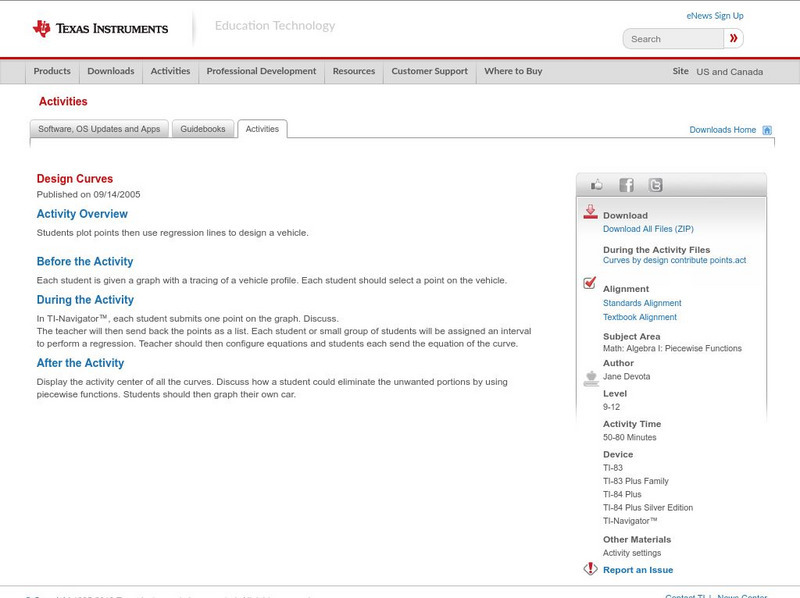
Texas Instruments: Design Curves
Students plot points then use regression lines to design a vehicle.
Mathematics Archives
Math Archives: Visual Calculus: Tangent Lines to Polar Graphs
This site give the formula for finding the slope of the tangent line to a polar graph. The page offers step by step explanations and worked examples.
Curated OER
Biz/ed: Virtual Economy Glossary: Gini Coefficient and Lorenz Curve
Glossary of terms that contains gini coefficient and lorenz curve. Both definitions contain a clear graph, scroll down to the L's to find lorenz curve.
Integrated Publishing
Plane Figures
This site describes lines and angles "as found in various plane (flat) geometric figures.".
CK-12 Foundation
Ck 12: Analysis: Tangents to a Curve
[Free Registration/Login may be required to access all resource tools.] Calculate the equation of a line tangent to a single point
Texas Instruments
Texas Instruments: The Slope of the Tangent Line (Part1)
In this activity, students use the CellSheet Application to approximate the slope of a line tangent to a curve.
Robert Schenk, PhD
Cyber Economics: Measuring Income Distribution
E learning text offers information on measuring income distribution with the Lorenz Curve. Site presents charts and data for one to use in order to construct or analyze a Lorenz Curve.
Other popular searches
- Straight and Curved Lines
- Measure Curved Lines
- Measuring Curved Lines
- Printing Practice Curved Lines


