Texas Education Agency
Texas Gateway: Modeling Data With Linear Functions
Given a scatterplot where a linear function is the best fit, the student will interpret the slope and intercepts, determine an equation using two data points, identify the conditions under which the function is valid, and use the linear...
Scholastic
Scholastic: Study Jams! Math: Data Analysis: Line Plots
Explore how to organize and plot data on a line plot by going step by step through the activity. Then test your knowledge to check for understanding.
Better Lesson
Better Lesson: What Does the Data Tell Us? Describing Data
Understanding how to interpret data by its shape, spread, and center helps students to understand statistics.
University of Georgia
University of Georgia: Inter Math: Types of Data
This site has a concise definition of "Data," plus examples of data types and collection methods.
National Council of Teachers of Mathematics
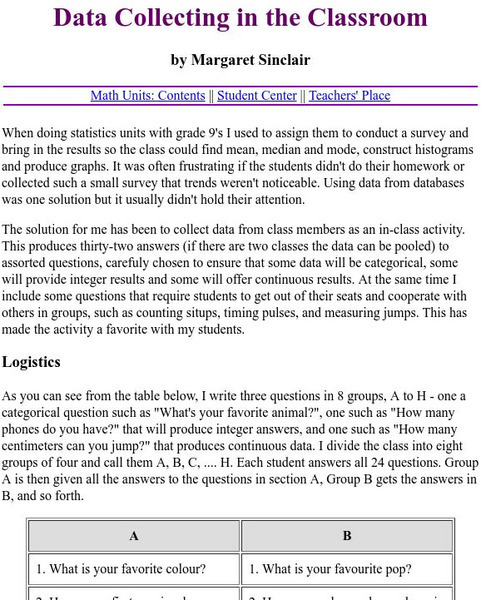
The Math Forum: Data Collecting in the Classroom
A list of two dozen questions students can easily ask eachother in the classroom to quickly collect data in hopes of using it in their study of making graphs. Some are opinion questions, while others require the counting of certain items...
Department of Defense
Do Dea: Spreadsheet Software: M6: L3: Outside the Box: Get External Data
In Module 6 Lesson 3 of this course on spreadsheets, students will learn how to import data that is in different formats and from a variety of sources, and transpose and format it. Includes slideshow tutorials.
Department of Defense
Do Dea: Spreadsheet Software Applications: M6: L2: Clean Up: Using Data Tools
In Module 6 Lesson 2 of this course on spreadsheets, students learn how to use data validation tools in Excel to minimize errors in manual data entry. Includes slideshow tutorials.
Khan Academy
Khan Academy: Unit: Intro to Sql: Querying and Managing Data
Learn how to use SQL to store, query, and manipulate data. SQL is a special-purpose programming language designed for managing data in a relational database, and is used by a huge number of apps and organizations.
Other
Beanz: Variables, Constants, and Data Types
Learn variables, constants, and data types with exercises you can do to test your knowledge.
Khan Academy
Khan Academy: Comparing Data Distributions
Take a look at two different data distributions and draw some comparisons.
Sophia Learning
Sophia: Using Graphs to Analyze Data
This lesson will demonstrate how to analyze and interpret data given in the form of a graph.
University of Regina (Canada)
University of Regina: Math Central: Data Management and Analysis Lessons
A collaboration of elementary level lessons on data management and analysis. Some examples of the topics demonstrated are grids, timelines, and weather.
CK-12 Foundation
Ck 12: Matrices to Represent Data
[Free Registration/Login may be required to access all resource tools.] A collection of resources to help students understand how to use matrices to represent and manipulate data, e.g., to represent payoffs or incidence relationships in...
K-5 Math Teaching Resources
K 5 Math Teaching Resources: 2nd Grade Measurement & Data: Measuring Paths [Pdf]
K-5 Math Teaching Resources: 2nd Grade Measurement and Data: Measuring Paths students will use different measuring materials different scenarios.
University of South Florida
Fcat: Drops on a Penny: Teacher Notes
Students learn how to create stem-and-leaf diagrams and boxplots by collecting data on the surface tension of water molecules. This hands-on activity using pennies is a great way to learn how to organize data.
National Geographic
National Geographic: The Politics of Place Naming
Students use an online geographic information system (GIS) to uncover the geographic and social context of streets named after Martin Luther King, Jr. They map street locations to identify regional patterns in honoring King, consider...
Center for Innovation in Engineering and Science Education, Stevens Institute of Technology
Ciese Real Time Data Projects: Building and Using Weather Instruments
In this lesson students will build and learn how to use three weather. They will use these instruments to collect weather data over a period of two weeks.
Utah Education Network
Uen: Generating and Recording Data
This "fish" activity will help early elementary students develop skills related to categorizing, recording data, developing vocabulary, and counting. An assessment rubric is attached.
Rice University
Rice University: Cynthia Lanius: Let's Graph
An introduction to bar graphs, both vertical and horizontal in nature. The interactive aspect of this site allows students to change the values of the data - their favorite cafeteria foods - and then see how the graph is changed.
Khan Academy
Khan Academy: Making a T Interval for Paired Data
In some studies, we make two observations on the same individual. For instance, we might look at each student's pre-test and post-test scores in a course. In other studies, we might make an observation on each of two similar individuals.
National Center for Ecological Analysis and Synthesis, University of California Santa Barbara
Nceas: What Are Data?
This site from NCEAS answers many questions about data. You can also learn about data, tables, and types of graphs in this informative site.
Carnegie Mellon University
Data and Story Library: Real World Stories of Statistics
This online library of data files and stories illustrates the use of basic statistics methods. The reader does not need to be a statistician to understand the topics discussed. Many of the short stories are humorous (the F-index of hot...
Other
Tulpehocken Area School District: Graphing and Analyzing Scientific Data
Student learning exercise with explanation of pie, bar, and line graphs, the parts of a graph, and the definition of mean, median, and mode. This summary is followed by an exercise for each type of graph within a scientific context.
Department of Defense
Do Dea: Spreadsheet Software: M4: L3: What's That Layout? Enhancing Charts
In Module 4 Lesson 3 of this course on spreadsheets, students learn how to use advanced features of Excel to simplify analysis of their data, for example, to make predictions about future trends or to take mini-snapshots of data trends...
Other popular searches
- Data, Census, & Statistics
- Data Collection
- Collecting Data
- Graphing Data
- Data Analysis Pictograph
- Categorical Data
- Data Tables
- Databases
- Data Analysis Lesson Plans
- Data Management
- Data Analysis Graphing
- Access Database


