Texas Education Agency
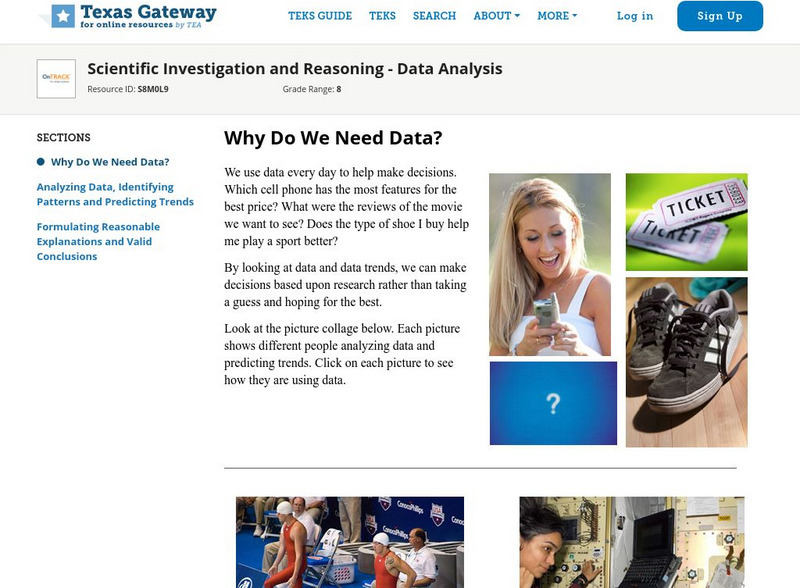
Texas Gateway: Why Do We Need Data?
We use data every day to help make decisions. Which cell phone has the most features for the best price? What were the reviews of the movie we want to see? Does the type of shoe I buy help me play a sport better?By looking at data and...
Texas Education Agency
Texas Gateway: Quantitative vs. Qualitative Data
This lesson explores quantitative vs. qualitative scientific data.
Other
Ocean Tracks: Fact or Artifact? Interpreting Patterns in Ocean Tracks Data [Pdf]
Ever wonder where marine animals go? How fast they swim? How deep they dive? Electronic tagging has opened a new window into the world of the open ocean. Ocean Tracks gives you access to data collected by tags on real live migrating...
The World Bank
World Bank: Data Catalog
This resource provides statistical data on numerous categories for nearly every country in the world. A great tool for a comparative analysis. Human, natural, and capital resources are all included.
Texas Education Agency
Texas Gateway: Scientific Investigation and Reasoning Data Organization
Using interactive exercises, students will review how to construct tables and graphs in order to organize data.
Government of Alberta
Learn Alberta: Math Interactives: Exploring Data Display and Graphs
This multimedia Learn Alberta math resource focuses on graphing data. In the video portion, students will see how math is involved in the display of merchandise in stores. The accompanying interactive component provides an exploration...
Center for Innovation in Engineering and Science Education, Stevens Institute of Technology
Ciese Real Time Data Projects: The Stowaway Adventure
Through this series of Internet-based learning experiences and activities, students will use real-time data to track a real ship at sea and monitor weather conditions. Includes a teacher's guide with problem-solving lesson plans...
US Environmental Protection Agency
Epa: Air Data
The AirData website gives you access to air quality data collected at outdoor monitors across the United States, Puerto Rico, and the U. S. Virgin Islands. The data comes primarily from the AQS (Air Quality System) database. You can...
Texas Education Agency
Texas Gateway: Selecting and Using Representations for Collected Data
[Accessible by TX Educators. Free Registration/Login Required] Given a variety of data (including line plots, line graphs, stem and leaf plots, circle graphs, bar graphs, box and whisker plots, histograms, and Venn diagrams), the student...
Texas Education Agency
Texas Gateway: Revising Persuasive Essay: Analysis of Data, Facts, and Ideas
[Accessible by TX Educators. Free Registration/Login Required] Learn strategies for evaluating and revising specific data, facts, and ideas included in an essay.
US Environmental Protection Agency
Epa: Air Data
Huge database for air quality data. You specify the information you need and AIRS will supply it. Pollution sources, maps, monitoring sites.
Texas Education Agency
Texas Gateway: Predicting, Finding, and Justifying Data From an Equation
Given data in the form of an equation, the student will use the equation to interpret solutions to problems.
NOAA
Noaa: Estuaries: Noaa: Science Data: Graphing
Create graphs of marine ecosystems using real-time data.
The World Bank
World Bank Group: Data by Topic
Links to data which cover agriculture, education, environment, health and population and other issues regarding economic development.
Khan Academy
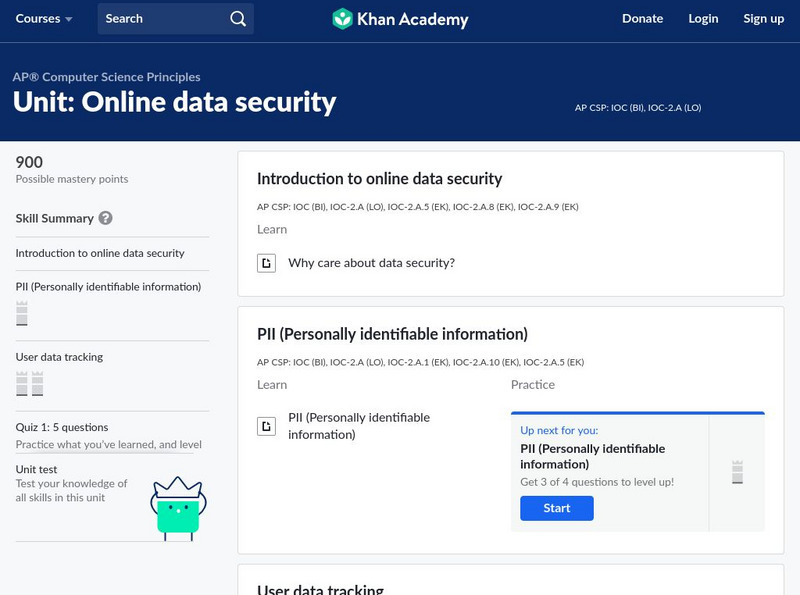
Khan Academy: Unit: Online Data Security
Readings and practice problems about online data security.
Khan Academy
Khan Academy: Read Line Plots (Data With Fractions)
Practice reading and interpreting data that is graphed on line plots. The data graphed includes fractions. Students receive immediate feedback and have the opportunity to try questions repeatedly, watch a video or receive hints....
CK-12 Foundation
Ck 12: Statistics: Displaying by Type of Data Grade 8
[Free Registration/Login may be required to access all resource tools.] Create and use different data displays to analyze and draw conclusions about different sets of data.
CK-12 Foundation
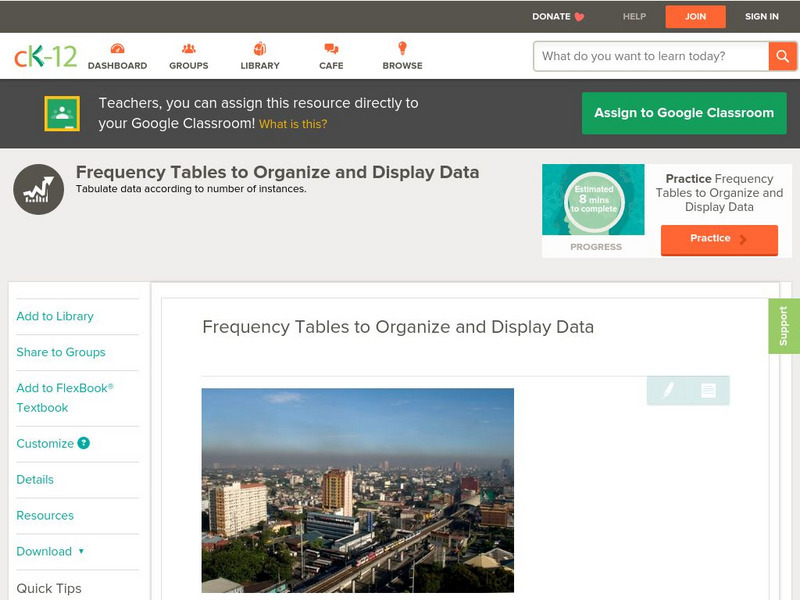
Ck 12: Frequency Tables to Organize and Display Data Grade 7
[Free Registration/Login may be required to access all resource tools.] Make a frequency table to organize and display data.
CK-12 Foundation
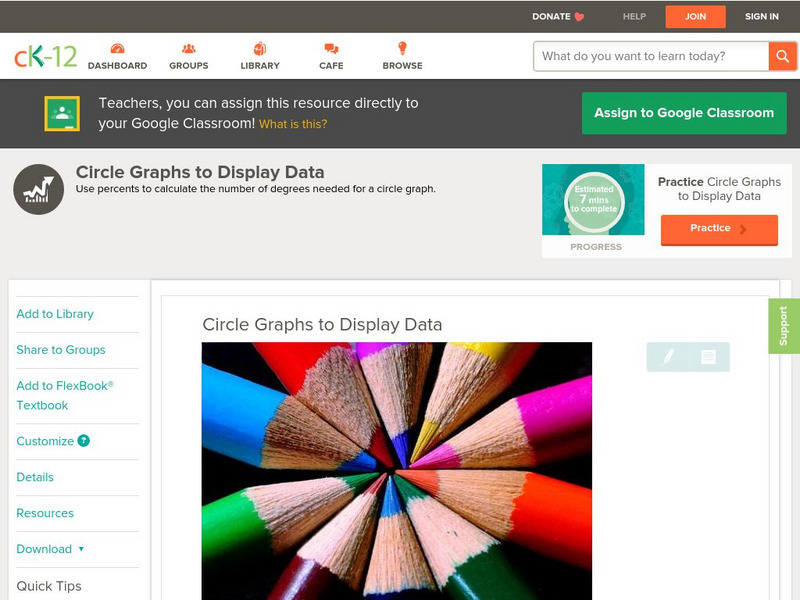
Ck 12: Statistics: Circle Graphs to Display Data Grade 7
[Free Registration/Login may be required to access all resource tools.] Make circle graphs by using given data.
TED Talks
Ted: Ted Ed: David Mc Candless: The Beauty of Data Visualization
Listen and watch as David McCandless turns complex data sets into beautiful, simple diagrams. He suggests that information design is really important because we all like to visualize our information. [18:19]
Other
Nearpod: Introduction to Data Representation
In this lesson on representation data, students explore how to make dot plots, histograms, and box plots and learn about outliers in a data set.
Read Works
Read Works:north America:comparing Data From Different Countries Around the World
[Free Registration/Login Required] A chart with land and population data from Canada, the United States of America, the United Kingdom, and Japan. A question sheet is available to help students build skills in reading comprehension.
CK-12 Foundation
Ck 12: Statistics: Displaying Bivariate Data
[Free Registration/Login may be required to access all resource tools.] This Concept shows students how to display bivariate data using scatter plots and line plots.
Texas Education Agency
Texas Gateway: Evaluating Data in Tables, Graphs and Charts
[Accessible by TX Educators. Free Registration/Login Required] In this lesson students look at examples of graphics, tables, charts, and graphs, and learn how to interpret their data. They will be able to use this skill to enhance their...
Other popular searches
- Data, Census, & Statistics
- Data Analysis Pictograph
- Data Table
- Categorical Data
- Data Analysis Lesson Plans
- Data Management
- Data Analysis Graphing
- Data Analysis and Graphs
- Science Fair Project Data
- Data Display
- Organizing Data
- Census Data

![Ocean Tracks: Fact or Artifact? Interpreting Patterns in Ocean Tracks Data [Pdf] Lesson Plan Ocean Tracks: Fact or Artifact? Interpreting Patterns in Ocean Tracks Data [Pdf] Lesson Plan](https://d15y2dacu3jp90.cloudfront.net/images/attachment_defaults/resource/large/FPO-knovation.png)


