Hi, what do you want to do?
Shodor Education Foundation
Shodor Interactivate: Comparison of Univariate and Bivariate Data
Young scholars learn about the difference between univariate and bivariate data and understand how to choose the best graph to display the data.
PBS
Pbs: Location Graphs
Use your skills of deduction to fill in the missing information and demonstrate your expertise at interpreting graphs. This interactive exercise focuses on how line graphs can be used to represent data and provides an opportunity to...
Math Slice
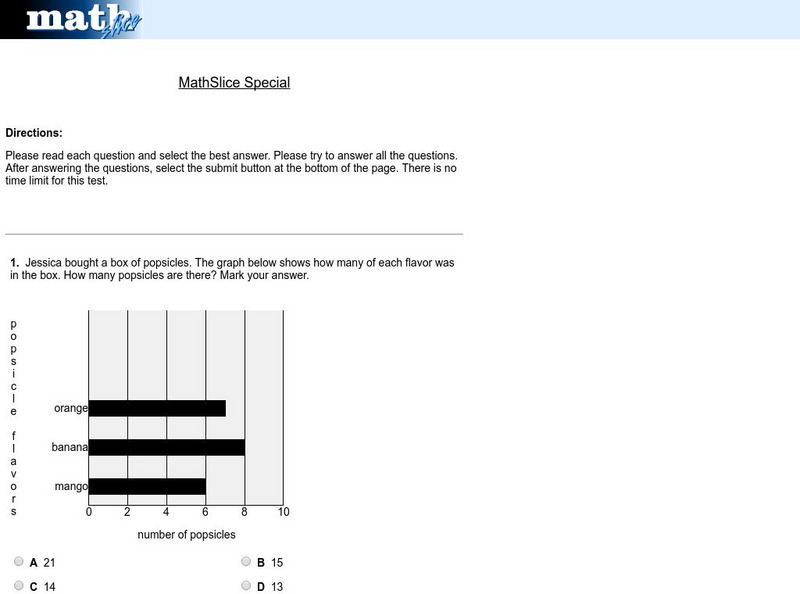
Math Slice: Chart Slice Special Test
A ten question test assessing data collection and analysis skills with bar graphs. Assessment is scored online. An excellent tool for assessment.
Illustrative Mathematics
Illustrative Mathematics: 8.sp.4 Music and Sports
This task looks at a possible relationship between playing a sport and playing a musical instrument. Students collect data from classmates, summarize the data into a two-way table, make some observations, and construct a bar graph of the...
Illustrative Mathematics
Illustrative Mathematics: F Bf 1,000 Is Half of 2,000
This task is about an online mathematics organization that is trying, over a four-year period, to generate 2,000 math problems that cover all grades. This real-life modeling task could serve as a summative exercise that draws on many...
Illustrative Mathematics
Illustrative Mathematics: 8.f Us Garbage, Version 1
Eighth graders work with input values (the year) and output values (the amount of garbage that year) in a table about the garbage produced in the US. They study the table to answer specific questions, state whether it represents a linear...
US National Archives
Nara: Explaining Trends in the Gender Wage Gap
This White House site provides a report on the gender wage gap by the Council of Economic Advisers. Includes historical data and statistical information, information on the different factors that affect gender pay, what pay...
University Corporation for Atmospheric Research
Ucar: Get the Picture Severe Weather
Students review graphs and charts of severe weather data then answer "True and False" questions about the content conveyed.
BSCS Science Learning
Bscs: Frog Eat Frog World
Using maps and graphs of large data sets collected in FrogWatch, students will determine the range, preferred land cover, and proximity to water of the American bullfrog to figure out the bullfrog's requirements for food, water, and...
Other
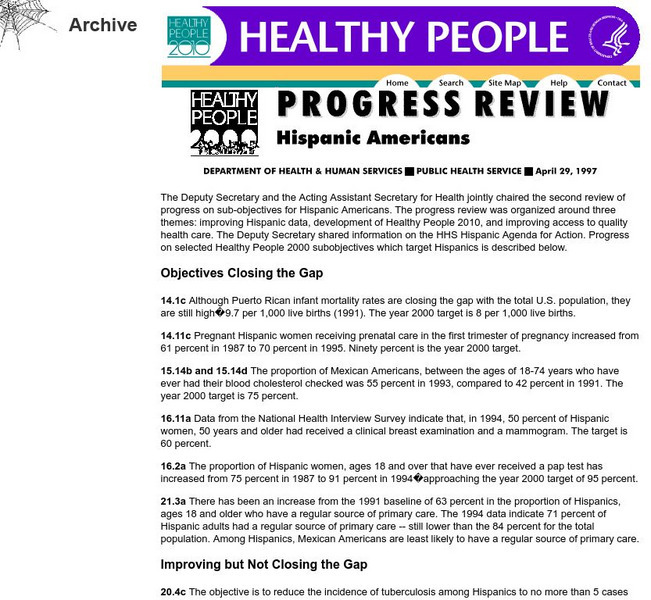
Hispanic Americans Progress Review
A Progress Review of Hispanic Americans from the Department of Health and Human Services from 1997. Target statistics graphs and other visual aids are included.
Science and Mathematics Initiative for Learning Enhancement (SMILE)
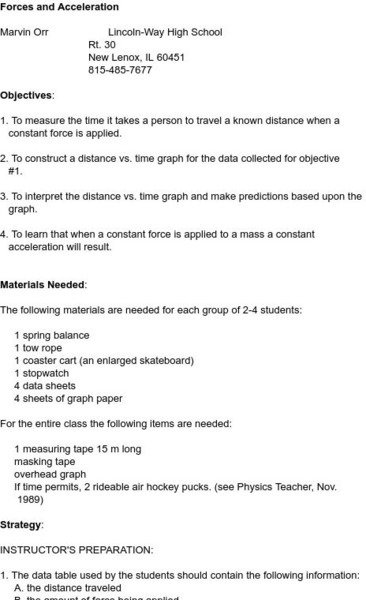
Smile: Lab Work Forces & Acceleration
The Illinois Institute of Technology provides this site. The site contains a graphing activity which illustrates that a constant force exerted upon an object results in constant acceleration. Rolling carts and stopwatches are used to...
Other popular searches
- Graphs and Data Display
- Graphs and Data
- Graphs and Data Handling
- Science Data and Graphs
- Analze Data and Graphs
- Interpret Graphs and Data
- Graphs and Data Analysis
- Probability Data and Graphs
- Graphs and Data Nalysis
- Bar Graphs and Data


