Curated OER
Sandia Aerial Tram
Your learners analyze a table of real-life data in order to write an equation that best models the information. Exponential, quadratic, and linear rates of changes are all possibilities in this task.
Curated OER
Graphing Inertia: An Oxymoron?
Eighth graders investigate Newton's Law of Inertia in order to create a context for the review of the use of different types of graphs. They practice gathering the data from an experiment and put it into the correct corresponding graph.
Curated OER
Lining Up Data
Students examine the concept of function and make models of data and predictions based on that data.
Curated OER
Exploring Linear Equations And Scatter Plots - Chapter 5 Review
Students complete rolling stocks experiment, and collect and enter data on the computer. They enter data on graphing calculators, complete scatter plot by hand with line of best fit, and discuss different graphing methods.
Curated OER
Dealing with Data in Elementary School
Students follow the scientific method in collecting data. In this following the scientific method in collecting data instructional activity, students develop a question they would like answered such as how many aluminum cans are...
Curated OER
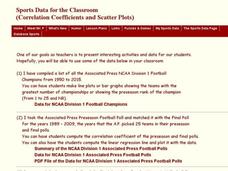
Sports Data for the Classroom
In this algebra worksheet,students rewrite word problems using algebraic expressions. They collect data and plot their findings on the graph and analyze it. There is an answer key for this worksheet.
Curated OER
Data Analysis and Probability Race to the Finish
Students practice addition facts, record data, and construct a bar graph. In this probability lesson, students participate in a board game in which bicycles move towards a finish line based on players completing addition problems. Dice...
Curated OER
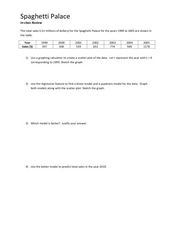
Spaghetti Palace
In this spaghetti palace worksheet sheet, learners examine data and create a scatter plot. They use their graphing calculator to find a linear model and a quadratic model for given information. Students predict total sales. This...
Curated OER
Comparing Linear and Exponential Data
Young scholars graph linear and exponential equations. In this algebra lesson, students differentiate between linear and exponential equations. They relate it to the real world.
Radford University
Projectile Motion and Quadratic Functions
Model the flight of a ball. Small groups collect time data for how long it takes to toss a ball between two people. The teacher leads a discussion about projectile motion to get the class thinking about how to calculate the equation of...
Curated OER
Dubious Adoption Data
Students analyze a graph from the New York City Administration for Children's Services that shows a significant increase in New York City adoptions after ACS was founded. They determine whether the graph supports ACS' claims and whether...
Curated OER
Model Data with Quadratic Functions
Students model data using quadratic equations. In this algebra lesson, students simplify and factor quadratic equations. They graph the function using collected data and analyze the parabola.
Curated OER
Collecting And Fitting Quadratic Data
Students investigate the concept of using quadratic data to plot coordinates on a plane. They also apply the quadratic formula for a variety of problems with the help of a graphing calculator to draw the parabola for given coordinates.
Curated OER
Statistical Analysis of Data by Gender
Students examine and identify gender bias, stereotyping, and discrimination in school materials, activities, and classroom instruction. They apply descriptive statistics knowledge to real-world data.
Curated OER
Making a Bar Graph
In this bar graph instructional activity, students analyze a data table and bar graph depicting information about stickers collected. Students answer 5 questions about the data displayed.
Curated OER
Two Ways to Solve
In this data table worksheet, students solve 4 word problems using the information on a data table about raffle tickets sold by 5 students.
Curated OER
Which Bag is Which?
Students explore number sense by completing a statistical analysis game in class. In this data graphing lesson, students utilize visual references such as colored cubes and tiles to map out the results of an experiment outcome such as a...
Curated OER
Read a Pictograph
In this data display worksheet, students solve 4 problems in which data on a tally chart and pictograph are analyzed. Students use this information to solve the problems.
Curated OER
Logarithmic Transformations of Data
Young scholars investigate and study logarithmic equations. In this precalculus lesson plan, students analyze the data behind the function. They define each graph as positive, negative or no correlation. They find the line of best fit.
Curated OER
Recording Data From a Survey Reteaching Worksheet
In this recording data from a surveys reteaching worksheet, 2nd graders review the use of tallies when recording data. They use the information to make a data table and a bar graph that displays the information.
Curated OER
Population Dilemma
Ninth graders explore population growth. In this Algebra I activity, 9th graders conduct an experiment simulating population growth. Students create a model and relate the results to a real-world situation. Students create a scatter...
Curated OER
Using Circle Graphs
In this circle graphs worksheet, students read a story about buying craft materials. Students examine the circle graph that shows how much spent on each type of material. Students then solve 3 problems using the data shown.
Curated OER
Line Plots
In this line plot learning exercise, students create a line plot of given data. They identify the range, clusters, gaps, and outliers. This one-page learning exercise contains 8 multi-step problems.
Curated OER
Horizontal Bar Graph-- Blank Grid
In this math activity, students use the blank horizontal bar graph to record and display any data and to learn the correct way to generate a bar graph. Spaces are marked for students to write in the title and labels; intervals of 1-10...
Other popular searches
- Graphs Interpreting Data
- Graphs and Data Display
- Continuous Data Graphs
- Circle Graph Data Set
- Extrapolation Graphs Data
- Graphs and Data
- Graphs and Data Handling
- Graphs Analyze Data
- Science Data and Graphs
- Pictorial Data Graphs
- Analze Data and Graphs
- Graphs Data Handling


