Other
Ocean Tracks: Fact or Artifact? Interpreting Patterns in Ocean Tracks Data [Pdf]
Ever wonder where marine animals go? How fast they swim? How deep they dive? Electronic tagging has opened a new window into the world of the open ocean. Ocean Tracks gives you access to data collected by tags on real live migrating...
Center for Innovation in Engineering and Science Education, Stevens Institute of Technology
Ciese Real Time Data Projects: The Stowaway Adventure
Through this series of Internet-based learning experiences and activities, students will use real-time data to track a real ship at sea and monitor weather conditions. Includes a teacher's guide with problem-solving lesson plans...
Other
Nearpod: Introduction to Data Representation
In this lesson on representation data, students explore how to make dot plots, histograms, and box plots and learn about outliers in a data set.
National Council of Teachers of Mathematics
The Math Forum: Seventh Grade Mathematics: Data Sense
This site has some interesting ways to collect and evaluate data. There are some activities about note taking, spreadsheets, surveys, and a cool bridge construction project. Teachers may want to use this site as a resource for some...
University of Illinois
University of Illinois: Data Types
The University of Illinois provides this site that is helpful because of the various kinds of data that can be collected. This lesson plan helps students differentiate between qualitative, quantitative, and many other types of data.
National Council of Teachers of Mathematics
The Math Forum: Growth Creature Lab Data Collecting
Lesson plan completely explains how students will collect data on the growth of an "alligator" and determine the relationship of the growth data to the Fundamental Theorem of Similarity and to topics in geometry in general. All of the...
Centers for Disease Control and Prevention
Centers for Disease Control: Bam! Body & Mind: Teacher's Corner: Collect & Analyze Safety Data
Students explore facts and figures for causes of injuries and deaths of children their age by conducting a classroom survey and analyzing the data. Students learn about different kinds of health data collected by the government, and...
Texas Instruments
Texas Instruments: Describing Categorical Data
Learners analyze the distribution of categorical data. They calculate percents and visually compare the data sets with a bar chart.
Science Education Resource Center at Carleton College
Serc: In Search of Globe Data
Students use GLOBE search tools to locate and display data from schools, and then use the data to answer questions regarding weather and climate.
Texas Instruments
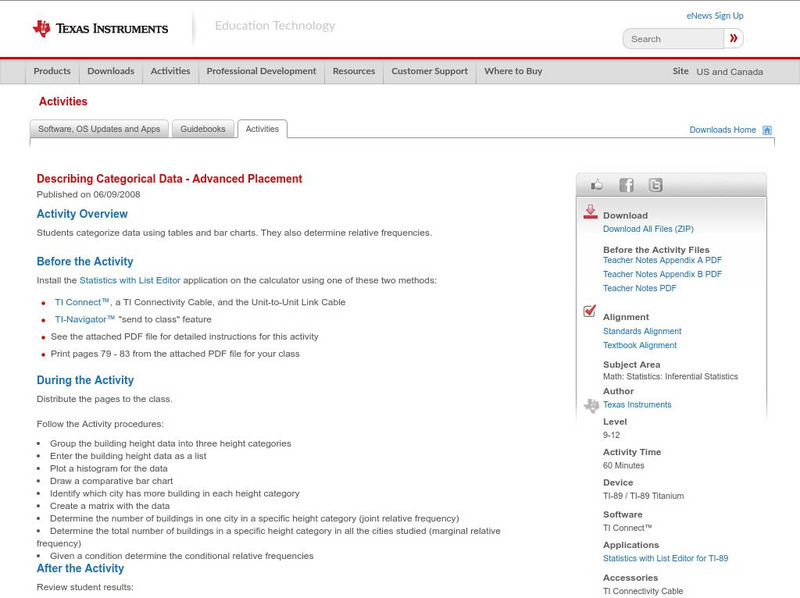
Texas Instruments: Describing Categorical Data Advanced Placement
Students categorize data using tables and bar charts. They also determine relative frequencies.
Google
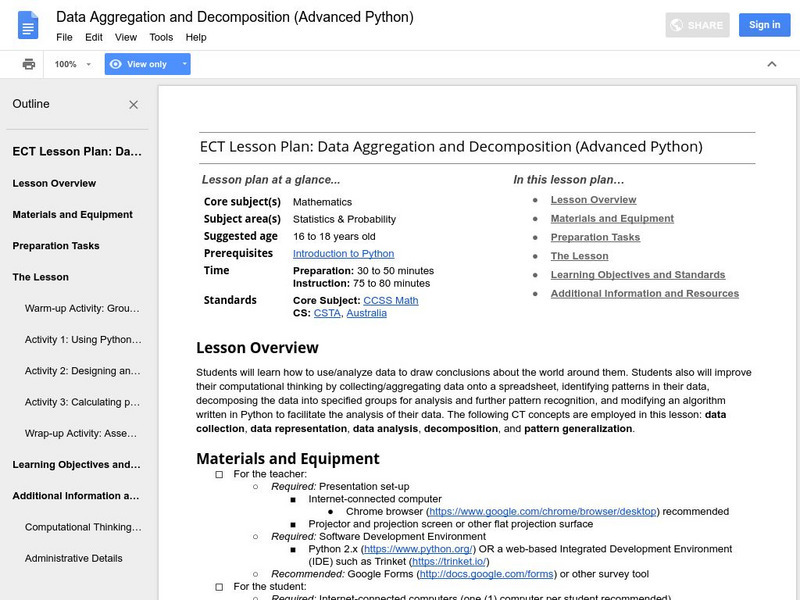
Google for Education: Data Aggregation and Decomposition (Python)
Students learn how to use and analyze data to draw conclusions about information collected from classmates. Then they use computational thinking by collecting and aggregating data onto a spreadsheet, identifying patterns in their data,...
Google
Google for Education: What Is Data
The purpose of this instructional activity is to show students what data is and how prevalent it is in their lives They also learn how to use data to make informed decisions. These activities are an excellent way to introduce the year as...
Google
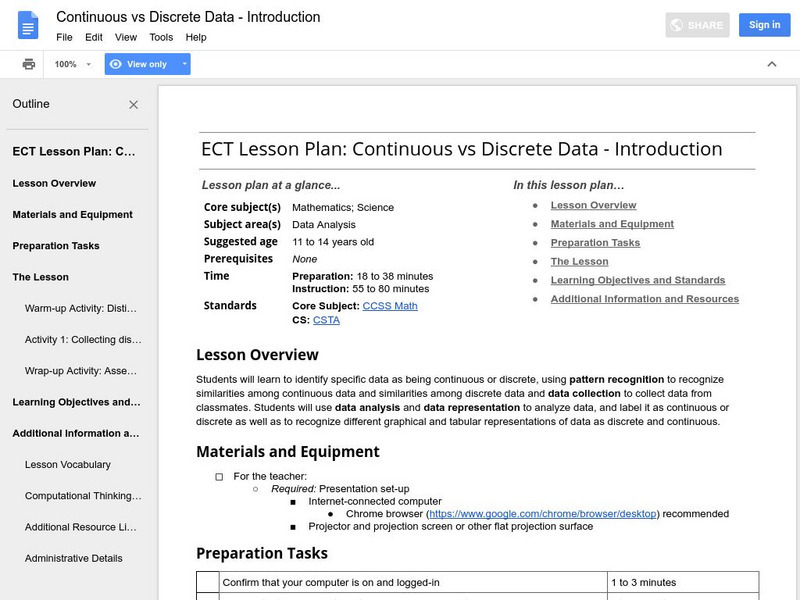
Google for Education: Continuous vs Discrete Data
When working with data, it is important to know whether it is continuous or discrete, as this will determine what calculations can be applied and what information can be extracted from it. Here, students to distinguish between continuous...
Google
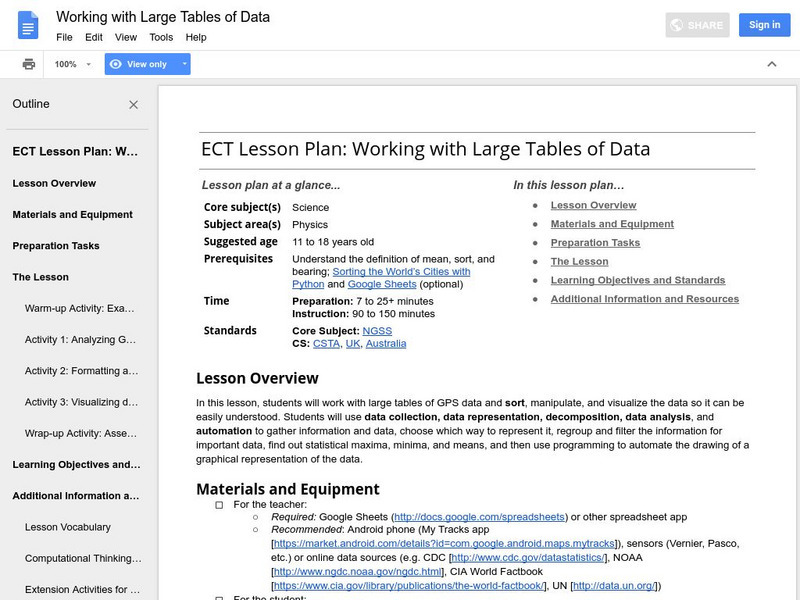
Google for Education: Working With Large Tables of Data
Students work with large tables of GPS data and sort, manipulate, and visualize the data so it can be easily understood.
Google
Google for Education: Data Aggregation and Decomposition (Excel)
By using Microsoft Excel, students collect, decompose, and re-aggregate class data. Students use computational thinking skills by decomposing long lists of information and writing basic algorithms to help analyze data.
Google
Google for Education: Using Data From Sensors
Students analyze data gathered from sensors and develop filtering algorithms for anomalies and outliers, then use these algorithms to make decisions on sensor data as it is being collected.
Science Education Resource Center at Carleton College
Serc: Lab 3: Discovering Local Data
An investigation that is part of a series of lab lessons that expose students to Earth Systems through research, data, and visulazations. This lab specifically has students using a database to gather and graph data to understand the role...
Other
Ns Dept. Of Education: Grades 9 12 Atlantic Canada Data Management [Pdf]
Statistics Canada prepared this document for use by teachers in Atlantic Canada. It lists instructional activity resources on the StatsCan website for data management, statistics and probability in the secondary curriculum.
Council for Economic Education
Econ Ed Link: Inflation Data: Is the Economy Healthy? (Grades 9 12)
This lesson asks students to identify sources for macroeconomic data, interpret data, describe the present state of the economy using current data, and use data to predict the state of the economy one year from now.
Google
Google for Education: Applyng Discrete and Continuous Data in a Spreadsheet
Students collect data in a spreadsheet and learn to use various functions and analysis tools to better see patterns in their eating habits.
Science Education Resource Center at Carleton College
Serc: Mn Step: Statistical Analysis of Lincoln
For this activity, students first work in groups to collect information about a set of pennies. They measure and record the mass for each one in a table using a spreadsheet program if possible. They also record its year and, for 1982...
Science Education Resource Center at Carleton College
Serc: Analyzing Greenhouse Gases and Global Temperature Data Over Time
In this activity, students plot data on the concentrations of various greenhouse gases in Earth's atmosphere and look for trends. They will learn that greenhouse gases allow the Sun's light to pass through them to the surface of Earth,...
Science Education Resource Center at Carleton College
Serc: Exploring Ncar Climate Change Data Using Gis
With ArcGIS and climate data from the National Center for Atmospheric Research Climate Change Scenarios GIS Data Portal, students learn the basics of GIS-based climate modeling.
Science Education Resource Center at Carleton College
Serc: A Data Rich Exercise for Discovering Plate Boundary Processes
This article in the Journal of Geoscience Education describes a classroom exercise based on four world maps containing earthquake, volcano, topographical and seafloor age data. Students participate in this exercise by using a "jigsaw"...
Other popular searches
- Data, Census, & Statistics
- Data Analysis Pictograph
- Data Table
- Categorical Data
- Data Analysis Lesson Plans
- Data Management
- Data Analysis Graphing
- Data Analysis and Graphs
- Science Fair Project Data
- Data Display
- Organizing Data
- Census Data
![Ocean Tracks: Fact or Artifact? Interpreting Patterns in Ocean Tracks Data [Pdf] Lesson Plan Ocean Tracks: Fact or Artifact? Interpreting Patterns in Ocean Tracks Data [Pdf] Lesson Plan](https://d15y2dacu3jp90.cloudfront.net/images/attachment_defaults/resource/large/FPO-knovation.png)


