Better Lesson
Better Lesson: What Does the Data Tell Us? Describing Data
Understanding how to interpret data by its shape, spread, and center helps students to understand statistics.
University of Regina (Canada)
University of Regina: Math Central: Data Management and Analysis Lessons
A collaboration of elementary level lessons on data management and analysis. Some examples of the topics demonstrated are grids, timelines, and weather.
University of South Florida
Fcat: Drops on a Penny: Teacher Notes
Students learn how to create stem-and-leaf diagrams and boxplots by collecting data on the surface tension of water molecules. This hands-on activity using pennies is a great way to learn how to organize data.
National Geographic
National Geographic: The Politics of Place Naming
Students use an online geographic information system (GIS) to uncover the geographic and social context of streets named after Martin Luther King, Jr. They map street locations to identify regional patterns in honoring King, consider...
Center for Innovation in Engineering and Science Education, Stevens Institute of Technology
Ciese Real Time Data Projects: Building and Using Weather Instruments
In this lesson students will build and learn how to use three weather. They will use these instruments to collect weather data over a period of two weeks.
Utah Education Network
Uen: Generating and Recording Data
This "fish" activity will help early elementary students develop skills related to categorizing, recording data, developing vocabulary, and counting. An assessment rubric is attached.
Better Lesson
Better Lesson: What Is Your Favorite Pet?
SWBAT create a bar graph to match a data set. SWBAT analyze the graph to find 3 pieces of information the graph shows them.
Better Lesson
Better Lesson: What Is Your Favorite Little Bear Story?
SWBAT create a bar graph to match a data set. SWBAT analyze the graph for 3 pieces of information.
Utah Education Network
Uen: Weather Walks
In this multi-day, young scholars will learn weather through multisensory approaches. Students will make daily predictions. After each daily prediction, they will collect measurement and observational data by taking walks in different...
Better Lesson
Better Lesson: Line Graph Activity
Data collected is represented in tables and the students will need to choose what they want to represent in their line graph.
University of Texas at Austin
Mathematics Teks Toolkit: And We Go Around
Collect and display data using a bar and circle graph to explore fractions and percents.
PBS
Pbs Learning Media: Graphs, Charts, and Tables: Targeted Math Instruction
At the end of this lesson about graphs, charts, and tables, students will be able to interpret and compare data from graphs (including circle, bar, and line graphs), charts, and tables.
Stanford University
Sheg: Document Based History: Reading Like a Historian: The Korean War
[Free Registration/Login Required] Young scholars are given an opportunity to look at two textbooks recalling the same event, but one is written in and for North Korean schools and the other in and for South Korean schools. After...
Michigan Reach Out
Michigan Reach Out: Do Plants Need Sunlight?
Do plants need sunlight? What happens to plants if they do not get sunlight? Young scholars will act like scientists in order to answer these questions. A scientist takes questions like this and then conducts an experiment to see what...
Science and Mathematics Initiative for Learning Enhancement (SMILE)
Smile: Apples a Peel to Me
This lesson plan helps children understand how to graph data by using both real objects, apples, and pictures of apples. Great activity for a variety of themes.
US National Archives
Docsteach: The Voting Record of the Constitution
In this activity, students will analyze a primary source document to find relevant historical data and measure the degree of agreement and disagreement during the Constitutional Convention.
US National Archives
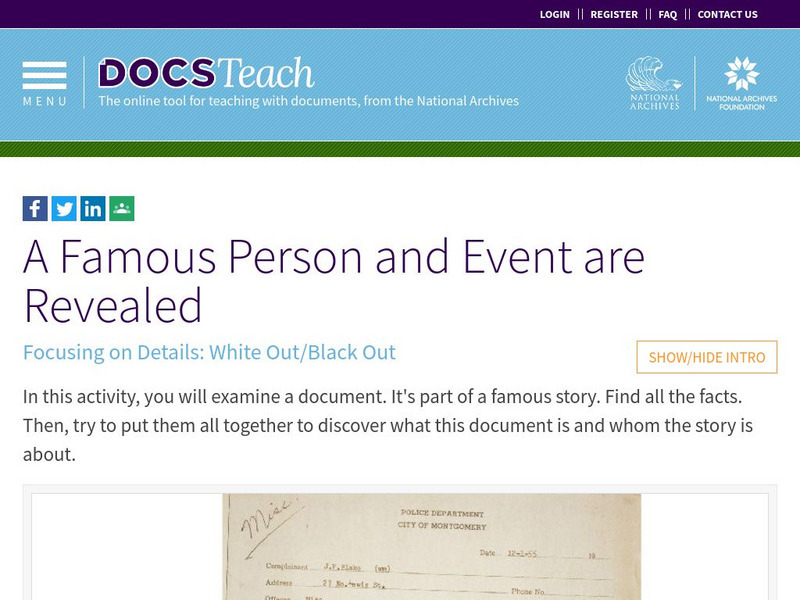
Docsteach: A Famous Person and Event Revealed: Examining an Arrest Record
This activity requires students to examine the arrest record of an un-named person. Students will analyze and evaluate the data contained in the document, applying prior knowledge, to discern what happened in the incident and the...
Center for Innovation in Engineering and Science Education, Stevens Institute of Technology
Ciese Collaborative Projects: Bucket Buddies: Environmental Study
Bucket Buddies is an opportunity for students to participate in a world-wide environmental study. By identifying organisms in pond water, participating classes can compare their findings, and look for relationships in data. In addition...
Better Lesson
Better Lesson: Exploring Weather One, Two, Three, Forecast!
Learners will use weather data they collect to predict future weather. Included in this lesson are a weather forecasting recording sheet and an example of a student's completed work.
University of Texas at Austin
The University of Texas Mc Donald Observatory: Super Gelatin
Students measure the angles of refraction of laser light traveling through gelatin, then plot their data to calculate the gelatin's index of refraction.
Better Lesson
Better Lesson: Greedy Gordy Can't Decide Working With Venn Diagrams
Students have been working with pictographs and bar graphs. Now they take their learning a step further by working with Venn Diagrams.
Better Lesson
Better Lesson: Super Sorter! Multiple Attribute Sorting With a Venn Diagram
Understanding multiple attributes is an important mathematical process. The students use their knowledge of Venn Diagrams in this lesson to gain more knowledge about this concept.
Science and Mathematics Initiative for Learning Enhancement (SMILE)
Smile: Relationships: Pressure, Volume, and Temperature
From the Science and Mathematics Initiative for Learning Enhancement (SMILE) program. A lesson plan that centers around a lab investigating the gas laws of Boyle, Charles, and Gay-Lussac. Data is collected, analyzed and discussed.
PBS
Pbs Teachers: Scientific American: Animal Einsteins: Figure That One Out
Investigate problem-solving techniques by using observation and data analysis skills. Observe how different people solve the same puzzle and make conclusions about how humans and animals think.
Other popular searches
- Data, Census, & Statistics
- Data Analysis Pictograph
- Data Table
- Categorical Data
- Data Analysis Lesson Plans
- Data Management
- Data Analysis Graphing
- Data Analysis and Graphs
- Science Fair Project Data
- Data Display
- Organizing Data
- Census Data


