Curated OER
Comparison of Two Different Gender Sports Teams - Part 3 of 3 Scatter Plots and Lines of Best Fit
Young scholars create a scatter plot for bivariate data and find the trend line to describe the correlation for the sports teams. In this scatter plot instructional activity, students analyze data, make predictions,and use...
Curated OER
Mean, Median, Mode, and Range: Reteach
For this line plots worksheet, students review how to make a line plot to show data and review the steps to find mean, median, mode, and range. Students then make a line plot for the data in exercise 1 and use it to answer the remaining...
Curated OER
Student Heights
Learners measure the heights of their fellow classmates and create a box and whisker plot to display the data. In this measurement lesson plan, students analyze the data and record results.
Curated OER
Mean, Median and Mode
Fourth graders describe weather data using the mean, median and mode. For this mean, median and mode lesson, 4th graders understand how to calculate data using mean, median and mode and why they would use each one.
Curated OER
Gender and Income
Students investigate Income and gender preference. For this statistic lesson, students collect data of Income to see if one gender makes more than the other. Students examine the data and draw conclusions.
Curated OER
Graphing Activity
In this probability and statistics worksheet, students work with a family member to construct graphs based on real life data. The two page worksheet contains three questions. Answers are not included.
Curated OER
Family Size
In this family size worksheet, students complete a tally chart to determine data from a family size line plot. They organize the data in the chart to determine the mean, median, mode, and range of the data. There are six problems in...
Curated OER
Chapter Books
In this line plot worksheet, students create a line plot of the chapter books read by the students of a class and find the median and mode. Students complete 3 tasks.
Curated OER
Skittles, Taste the Rainbow
Fifth graders learn and then demonstrate their knowledge of a bar and a circle graph using the classroom data. Students are given a pack of skittles candy. Students create a bar and circle graph indicating the results of the contents of...
Curated OER
Misleading Graphs
Students explore number relationships by participating in a data collection activity. In this statistics instructional activity, students participate in a role-play activitiy in which they own a scrap material storefront that must...
Curated OER
Getting A Grip On Graphs
Fourth graders investigate the concept of graphing and comparing different types of data using pictographs, line graphs, scatter plots, etc... They gather data and make interpretations while examining the medium of how it is displayed.
Curated OER
Stemmin'-n-Leafin'
Students make stem and leaf charts to determine the measures of central tendency using test score data. They analyze the data to draw inferences which they share with the class. They complete the associated worksheets.
Curated OER
Lahar Travel Time
Ninth graders analyze published geologic hazard maps of California and comprehend how to use the map's information to identify evidence of geologic events of the past and present and predict geologic changes in the future. They select...
Curated OER
How Creepy!
Students observe and measure a model of slow down slope movement. In this graphing lesson students collect, record, and organize data that apply to models.
Curated OER
Graphing Climate Information
Seventh graders plot the data for the average monthly precipitation for three cities. They make a graph using a spreadsheet.
Curated OER
ou are the Researcher!
Students conduct a census at school. They collect data, tally it, and create a frequency table. Students display their data in three different types of graphs. They write complete sentences describing the graph.
Curated OER
Discovering Pi
Students develop a formula that describes the functional relationship of the circumference of a circle to its diameter. Working with a partner, they measure the diameter and circumference of circular objects in order to discover the...
Curated OER
Lesson 6-7: Scatter Plots and Equations of Lines
In this scatter plot worksheet, students examine tables and write a linear equation that matches the table. Students graph linear equations. They read scatter plots, determine the trend line, and write a linear equation to...
Curated OER
A Wet Welcome Home
Students investigate data collection and analysis. In this Algebra I activity, students create a scatter plot and find the equation of best fit in a simulation of a leaking water pipe.
Curated OER
Straight Line Graphs
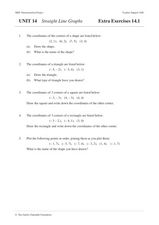
In this algebra worksheet, students graph coordinate pairs on a coordinate plane. They match points with letters and graph a line through all the plotting to create a straight line. There are 25 questions with an answer key.
Curated OER
Line of Best Fit
Students identify the line of best fit. In this statistics activity, students collect and analyze data. They calculate the regression equations and identify the different types of correlation.
Curated OER
Lines of Best Fit
High schoolers determine if there is an associationm in a scatter plot of data. They analyze data through predictios, comparisons, and applications. Students calculate the line of best fit using a graphing calculator. They display data...
Curated OER
Lines of Best Fit
Young scholars explore the concept of line of best fit. In this line of best fit lesson plan, students find lines of best fit in examples about riding your bike home from school and dentistry. Young scholars find two data points and find...
Curated OER
Scatter Plots
In this scatter plots worksheet, learners solve and complete 4 different problems. First, they use the table shown to model the relation with a scatter plot and trend line and to predict the value of a variable when given the other...


