Curated OER
Graphing and Analyzing
For this graphing and analyzing worksheet, 9th graders first state if each graph represents a linear or nonlinear relationship. Second, they create a difference table for each set of data presented and determine whether it represents a...
Pennsylvania Department of Education
Equal Groups
Students explore statistics by completing a graphing activity. In this data analysis instructional activity, students define a list of mathematical vocabulary terms before unpacking a box of raisins. Students utilize the raisins to plot...
Curated OER
Spaghetti Graphs
Young scholars work in pairs to test the strength of spaghetti strands. They collect and graph data to determine a line of best fit. Students create a linear equation to interpret their data. Based on the data collected, young scholars...
Inside Mathematics
Scatter Diagram
It is positive that how one performs on the first test relates to their performance on the second test. The three-question assessment has class members read and analyze a scatter plot of test scores. They must determine whether...
Curated OER
Water Down the Drain
Did you know that leaky faucets waste $10 million worth of water? Conservationists perform an experiment and draw best-fit lines to explore how the US Geological Society determined this value.
Curated OER
Let's Plot Points
Use coordinate grid paper to plot points and identify shapes that are already plotted on the paper by saying their coordinates. Pupils also measure the distance between points and play the game Battleship. There are several web links and...
Radford University
Action Bungee Jump
Drop scatter plots onto the class. Teams collect data to determine how far an action figure will fall suspended by rubber bands. Using the collected data, groups determine a line of best fit. Given a drop height, they also determine the...
Beyond Benign
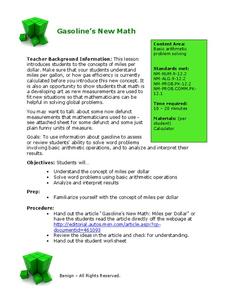
Got Gas
How much gas does it take to drive around town? The class uses a variety of mathematical procedures to take a look at the use of gas for transportation. Class members use a different unit to determine the cost of driving a car as opposed...
Mathed Up!
Frequency Polygons
Frequency polygons are a different way to represent frequencies over intervals. Pupils take frequencies for intervals of data from a frequency table and plot them as a frequency polygon. Budding mathematicians find information about the...
Georgia Department of Education
The Basketball Star
Have learners use math to prove they are sports stars! Assess a pupil's ability to create and analyze data using a variety of graphs. The class will be motivated by the association of math and basketball data.
Curated OER
Data Shuffle
Students find an advertisement or newspaper using charts or graphs. They create another graph using the same information in a different format. They write a comparison of the two graphs.
Curated OER
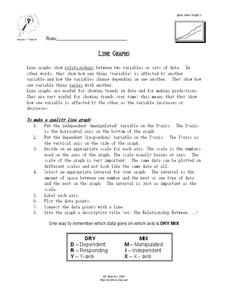
Line Graphs
In this algebra worksheet, young scholars describe the relationship between a line graph and its data. They define the reasons line graphs are used and discuss increasing and decreasing lines. There is one involved questions, requiring...
Curated OER
Box-and-Whisker Plots
Eighth graders measure in feet and inches and convert to explore the relationship between the converted measurements. In this measurement activity, 8th graders use the whisker and box plot to represent the measurement of a cat. ...
Curated OER
Plot It
Young scholars use a stem-and-leaf plot from a set of data to identify the range, median, and mode of their own math grades.
Curated OER
Enzymes at Work
The first four questions on this assignment require the use of critical thinking skills to apply the action of enzymes to different situations. Biologists then interpret enzyme activity data in a table and answer questions about it. This...
Curated OER
Means of Growth
Students collect and graph data. In this statistics lesson, students analyze their plotted data using a scatter plot. They identify lines as having positive, negative or no correlation.
Curated OER
Cruising the Internet
Students identify the parts of an engine using a graph. In this statistics lesson, students make a graph from their collected data. They calculate the volume of a cylinder using a line of regression and a scatter plot.
Curated OER
Box and Whisker Plots
Seventh graders explore the concept of box and whisker plots. In this box and whisker plots instructional activity, 7th graders plot data on a box and whisker plot. Students discuss the mean, median, and mode of the data. Students...
Curated OER
Spaghetti Bridges
Eighth graders experiment with building bridges of spaghetti, pennies, and a cup to determine how varying the number of spagetti pieces affects the strength of the bridge. They graph their results and interpret the data.
Curated OER
Family Activity: Bar Graphs and Line Graphs
In this math instructional activity, students work at home with a family member on a graphing activity. Students count the number of cans, glass jars, boxes and bags in the pantry. Students make a bar and a line graph to represent the data.
Scholastic
Study Jams! Choosing the Correct Graph
With so many types of graphs, don't let your learners get stuck figuring out which one to use. To track how Zoe spent her allowance, use this interactive lesson to review all the types of graphs and pick the best one to display the data....
Teach Engineering
Graphing Equations on the Cartesian Plane: Slope
Slopes are not just for skiing. Instructors introduce class members to the concept of slope and teach them how to calculate the slope from a graph or from points. The lesson also includes the discussion of slopes of parallel and...
Curated OER
Highs and Lows
Plot data using the number line and discuss how negative numbers are used in math and science. Sixth and seventh graders share their graph with the class and provide an explanation for their plotting.
Curated OER
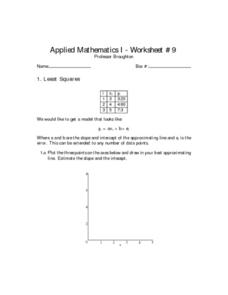
Least Squares
In this least squares activity, students solve 6 different problems that include the least squares of numbers. First, they plot 3 points on the axes shown and draw in their best approximating line. Then, students estimate the slope and...


