Curated OER
Celsius to Fahrenheit
Students convert degrees between two different units. In this algebra lesson, students graph linear equations and identify the line of best fit. They use their line of best fit to make predictions given a set of data.
Curated OER
Calculating Total Radiation Dosages at Mars
In this Mars radiation worksheet, students use data from the Mars Radiation Environment Experiment to solve 4 problems. They determine the total radiation dosage during a specific period of time, they determine the dosage during the...
Texas Instruments
Measure Up!
Statisticians take things to new heights using a set of height measurements. Students use TI-82 or TI-83 calculators to determine extreme values and the median for the data. They also construct a box-and-whisker plot to summarize the...
Curated OER
Birthdays
In this problem solving worksheet, 3rd graders complete a line plot by placing nine bits of information on the given line. They answer two comprehension questions about the line plot.
Curated OER
Graphs
Students explore graphs and define the different ways they are used to display data. In this algebra instructional activity, students collect data and plot their data using the correct graph. They draw conclusions from their graphs based...
Curated OER
Fitting Periodic Functions-Distant Planets
In this periodic functions instructional activity, students use given data of the speed of a star and find the best fit periodic function that follows the trend in data. They determine the amplitude, offset phase and the formula for the...
Curated OER
Strike a Pose: Modeling in the Real World (There's Nothing to It!)
Adjust this lesson to fit either beginning or more advanced learners. Build a scatter plot, determine appropriate model (linear, quadratic, exponential), and then extend to evaluate the model with residuals. This problem uses real-world...
Curated OER
Earth's Warming Climate: Are We Responsible
Students examine the atmospheric data for CO2. In this web-based atmospheric lesson, student follow instructions to examine and plot on-line scientific data about the CO2 levels in our atmosphere and analyze the changes found in the data.
Curated OER
Exploring Diameter and Circumference
Learn how to identify the diameter and circumference of a circle. Then, collect data on a circle and relate it to the diameter and circumference of a circle. Last, plot data and find the line of best fit.
Curated OER
Super Bowl Champs
In this Super Bowl worksheet, students create line plots of all winners and losers of the Super Bowl. They create stem-and-leaf plots, scatter plots, and bar graphs of football data. This one-page worksheet contains...
Curated OER
Fermi Detects Gamma-Rays from Messier
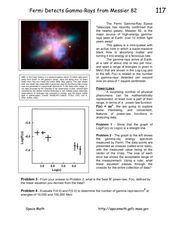
In this power law function worksheet, students use data from the Fermi Gamma-Ray Space telescope to apply the power law function to physical phenomena. Students use a graph to solve four problems.
Creative Chemistry
Thermometric Titration
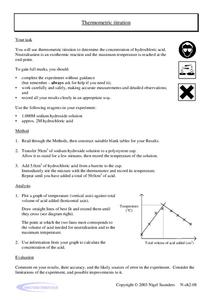
In this thermometric titration learning exercise, learners titrate hydrochloric acid with sodium hydroxide to determine its concentration. They measured the solution's change in temperature, plotted their data, and used the graph to find...
Curated OER
Exploring The Depths!
Fifth graders make a model of the ocean floor. For this ocean characteristics lesson, 5th graders complete a KWL chart about the ocean floor, use the Ocean Depth Data Sheet to create a graph, and create a 3-D model of the ocean...
NASA
Benford's Law
In this Benford's Law learning exercise, high schoolers read about the first digit frequency of numbers. Students solve 3 problems about sunspot numbers, solar wind magnetism and the depth of the latest earthquakes by using on line sites...
Alabama Learning Exchange
The State Capital of Stem and Leaf
Students explore the concept of stem and leaf plots. In this stem and leaf plots instructional activity, students plot the 50 US states' capitals on a stem and leaf plot according to the first letter of each state. ...
Curated OER
Statistics
In this statistics worksheet, students solve 2 problems that involving plotting data, recognizing ordered pairs, and analyzing the graphed relationship.
Curated OER
Bird Feeding and Migration Observation
Students research bird migration and build a bird house. In this bird lesson plan, students research the birds in their area and where they migrate to. They also build their own bird house and record data on what kinds of birds come to...
Curated OER
Life Expectancy at Birth
Students create a line graph on the life expectancy for males and females in Canada. In this math and health lesson plan, students review table and graph terminology, create line graphs, and analyze the differences in life expectancy...
Curated OER
Types of Graphs
Fifth graders construct graphs. In this graphing lesson, 5th graders learn about various types of graphs such as bar, line, circle, picture and stem and leaf plot. Students work in groups to create examples of each graph.
Curated OER
Statistics
In this statistics activity, students view 6 graphs to determine the correlation. Students then answer 4 questions that involve plotting data, determining a relationship, and making predictions.
Curated OER
Lesson 3 Activity 1: On the Trail of Knowledge
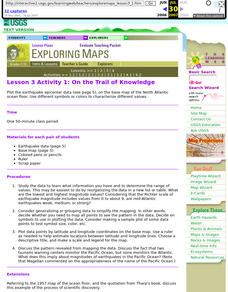
Students plot the earthquake epicenter data on the base map of the North Atlantic ocean floor using different symbols or colors to characterize different values.
Curated OER
Curriculum Activities: Ecological Concepts
Students explore a variety of microclimates to develop an awareness of why organisms live where they do. Moisture, time of day, land cover, and temperature form the basic concepts of this investigation.
Curated OER
Plot! Analyze! Draw your Conclusions!
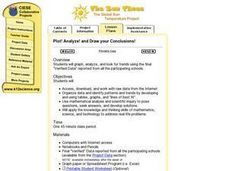
Students download data reported from the Global Sun Temperature Project website. They graph and analyze the data looking for trends and patterns. They prepare a class report with their observations and post it to the website.
Curated OER
Plotting the Petroleum Plume
Eighth graders examine the difference between confining layers and aquifers in a basic water table aquifer scenario. They contour groundwater elevation and petroleum product thickness data.


