Curated OER
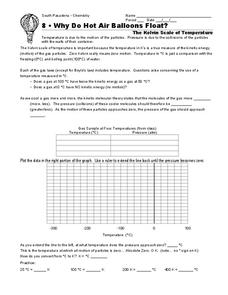
Why Do Hot Air Balloons Float?
In this gases worksheet, students read about the Kelvin scale of temperature, they answer 3 fill in the blank questions about the relationship between temperature and pressure and they plot the temperature and pressure of gas samples at...
Curated OER
Probability Popsicle Pop-ups
Fourth graders decorate and use popsicle sticks as manipulatives to assist with their learning of probability. They utilize a worksheet imbedded in this plan to organize the results of their experiment. They make a stem and leaf plot...
Curated OER
Biological and Agricultural Engineering
Eighth graders explore mathematics by conducting a series of investigations using a colorimeter. In this math lesson, 8th graders explain the purpose of food irradiation. They collect data and graph them.
Texas Instruments
Say What You Mean!
Young scholars analyze data and identify the mean. In this probability lesson, students log data in the TI and construct scatter plots from the data. They identify properties of a scatterplot.
Curated OER
Predator Prey Population Links
Fifth graders relate population of animals to its available food supply. They participate in an experiment and gather information. They use the data to draw conclusions.
Curated OER
Snow Cover by Latitude
Learners create graphs showing the amount of snow coverage at various points of latitude and compare graphs.
Curated OER
Correlate This!
Learners investigate different correlations. In this algebra lesson, students analyze graphs and identify the lines as having positive, negative or no correlation. They calculate the line of best fit using a scatter plot.
Curated OER
Linking Algebra to Temperature
Learners convert between two units as they calculate the temperature. In this algebra lesson, students collect data on seasonal climate and create a graph. They make conjectures based on their data collection.
Curated OER
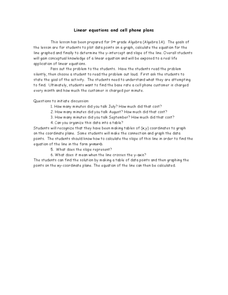
Linear Equations and Cell Phone Plans
Young scholars calculate the amount of minutes they get charged for each month. For this algebra lesson, students relate linear equations to talking on the phone and the cost to do so. They create graph to plot the cost and usage of the...
Curated OER
What's The Point?
Students solve word problems using the correct math symbols. For this algebra lesson, students use the TI calculator to graph their equation and analyze it. They find the line of regression and use to draw conclusion.
Curated OER
School-Wide Recycling
Students investigate recycling. In this environmental activity, students design a recycling program for their school. Students collect data about how much recyclable materials they use in one week. Students also survey classmates about...
Curated OER
Mathematical Models with Applications: The Sounds of Music
Students use an electronic data-collection device to model the sound produced by a guitar string. They identify the graph of a periodic situation and use the graph to determine the period and frequency of sound waves.
Curated OER
Slip Slide'n Away
Young scholars analyze the sliding of boxes along a warehouse floor. In this algebra lesson, students connect math and physics by calculating the friction created by the sliding of each box. They develop faster method to move the box,...
Curated OER
It's a Drag!
Students create number lines using decimals and whole numbers. In this algebra lesson, students graph and solve linear equations. They plot ordered pairs on a coordinate plane correctly.
Curated OER
Surface Meteorological Observation System (SMOS)
Young scholars investigate local surface weather conditions. They log weather conditions for thirty days, develop a graph, plot cloud cover, and compare/contrast the graphed lines of various weather factors.
Curated OER
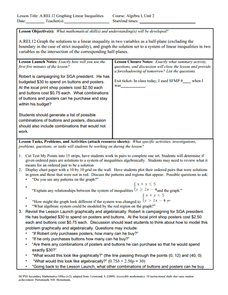
Graphing Linear Inequalities
Eighth graders extend skills for representing and solving linear equations to linear inequalities. Lesson activities build understanding and skill by plotting ordered pairs of numbers that either satisfy or do not satisfy a given...
Curated OER
Who Does the Lottery Benefit?
Young scholars investigate the pros and cons of the lottery. In this algebra lesson, students use the formulas for permutation and combination to test their arguments about the lottery. They collect data about their argument and plot it...
Curated OER
Graphing Data - Temperature
Seventh graders measure and record temperature over a given time period. They compare the recorded temperatures to the 40-year recorded normal average temperatures for the same area. Students display and interpret their findings in a graph.
Curated OER
Hit Me If You Can!
Students graph linear equations using slopes and intercepts. In this algebra lesson plan, students identify the slope as being positive,negative or undefined. They differentiate between different quadrants on a coordinate plane.
Curated OER
Opening the Case
Students participate in a class survey and then design an experiment and use graphs and statistics to assist them in solving a problem. They organize the results of the survey in a stem-and-leaf plot and find the range, median, mean, and...
Curated OER
Let's Graph It!
Students graph the height of others in centimeters and inches, find the slope of line in order to calculate the conversion factor between centimeters and inches.
Curated OER
Exponential Functions: Half Life and Doubling Time
Students investigate the concept of exponential functions and how they increase in size over time. They simplify the functions in order to find the solutions that are possible and perform analysis of the curved line that is produced when...
Curated OER
Graphs and Functions
Pupils are introduced to plotting functions on the Cartesian coordinate plane seen several categories of functions, including lines and parabolas
Curated OER
Introduction to Science
Seventh graders investigate scientific methods to solve problems. They demonstrate creating data tables and graphs. They study the role of a scientist and the importance of safety in a science lab. They distinguish between an...
