Khan Academy
Khan Academy: Line Plots Review
Reviews what line plots are and how to make them. Includes some practice problems with explanations of the solutions.
Cuemath
Cuemath: Data Handling
This comprehensive guide about data handling helps with understanding how the study of data handling and graphical representation of the data along with other tools help us in dealing with numerical data. Includes solved examples and...
Oswego City School District
Regents Exam Prep Center: Categorizing Data
Three lessons on different types of data (qualitative, quantitative, univariate, bivariate, biased data) as well as a practice activity and teacher resource.
Annenberg Foundation
Annenberg Learner: Creating a Line Plot
Watch as a physical stack of coins is added as a series of dots to a line plot.
Khan Academy
Khan Academy: Graph Data on Line Plots
Record measurements on line plots (also called dot plots). Students receive immediate feedback and have the opportunity to try questions repeatedly, watch a video or receive hints.
Khan Academy
Khan Academy: Practice: Make Line Plots
A practice quiz where students construct line plots using the information given in the problems. Includes hints.
Better Lesson
Better Lesson: Jumping Into Math, Measurement & Data Day 2
Third graders create line plots and analyze data using measurement data with quarter unit fractions.
McGraw Hill
Glencoe: Using Graphs to Understand Data Quiz
This is a quiz with five quick questions to check your knowledge of how to use graphs to understand data. It is self-checking.
Varsity Tutors
Varsity Tutors: Hotmath: Practice Problems: Correlation and Lines of Best Fit
Twenty problems present a variety of practice determining correlation based on data in a scatter plot and using lines of best fit with given data. They are given with each step to the solution cleverly revealed one at a time. You can...
Khan Academy
Khan Academy: Comparing Data Displays
Practice interpreting and comparing dot plots, histograms, and box plots. Students receive immediate feedback and have the opportunity to try questions repeatedly, watch a video or receive hints.
Khan Academy
Khan Academy: Creating Box Plots
More practice making box plots to summarize data sets. Students receive immediate feedback and have the opportunity to try questions repeatedly, watch a video or receive hints.
Oswego City School District
Regents Exam Prep Center: Scatter Plots and Line of Best Fit
Use this lesson, practice exercise, and teacher resource in planning instruction on scatter plots and line of best fit. In the lessons, you'll find definitions and examples of ways to make a scatter plot, determine correlations, and find...
Annenberg Foundation
Annenberg Learner: Making a Stem and Leaf Plot
A line plot may not be a useful graph for investigating variation so we must come up with a new representation based on groups of data. Construct a stem and leaf plot from a set of 26 data values.
CK-12 Foundation
Ck 12: Algebra: Fitting Lines to Data
[Free Registration/Login may be required to access all resource tools.] Learn how to write equations of best fit lines.
Math Is Fun
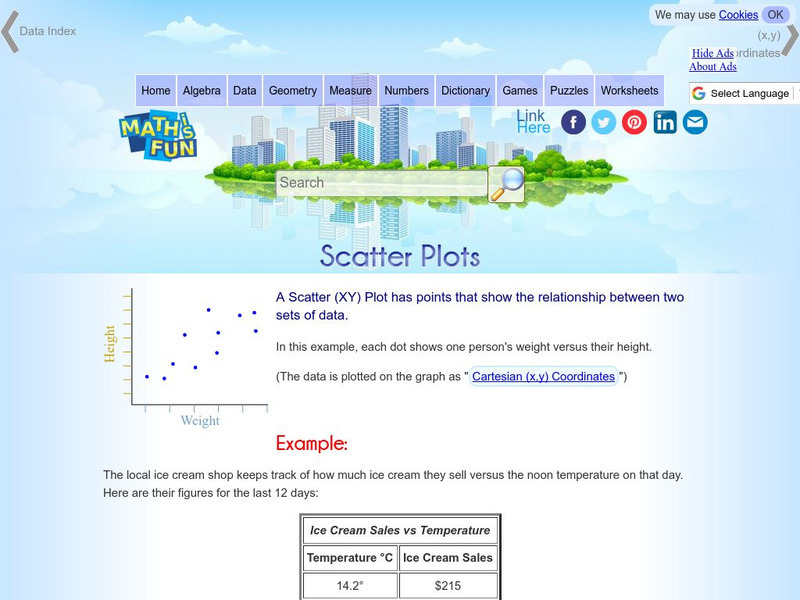
Math Is Fun: Scatter Plots
Explains, with examples, what scatter plots are and how to interpret the data. Discusses trends, interpolation and extrapolation, and correlation. Includes a set of practice questions.
ClassFlow
Class Flow: Data Analysis Using Graphing
[Free Registration/Login Required] This flipchart allows students to analyze data using appropriate graphs, including pictographs, histograms, bar graphs, line graphs, circle graphs, and line plots introduced earlier, and using...
Other
Mr maffesoli.com: Line Plot Worksheet E [Pdf]
Fifth graders will interpret data from a line plot and will create a line plot from given information.
Illustrative Mathematics
Illustrative Mathematics: Fractions on a Line Plot
Students will play a game with a partner to create a line plot with fractions.
Other
Mr maffesoli.com: Line Plot Worksheet D [Pdf]
Fifth graders will interpret line plot information to answer questions and create a line plot.
Other
Mr Maffesoli: Line Plot Worksheet F: Study Guide and Intervention [Pdf]
Fifth graders will complete a study guide and create a line plot.
Other
Mr maffesoli.com: Line Plot Worksheet I [Pdf]
Fifth graders will answer word problems from information on a line plot.
Other
Mr maffesoli.com: Line Plot Worksheet G [Pdf]
Fifth graders will complete a activity on interpreting and creating line plots.
Other
Mr maffesoli.com: Line Plot Review [Pdf]
Fifth graders will follow the guidelines to create a line plot from the given information.
Better Lesson
Better Lesson: Graphing Our Snack Mix: Review of Graphing
Second graders review how to make bar graphs, line plots, and pictographs by tallying the contents of snack mix and building graphs to show their data.


![Mr maffesoli.com: Line Plot Worksheet E [Pdf] Unknown Type Mr maffesoli.com: Line Plot Worksheet E [Pdf] Unknown Type](https://content.lessonplanet.com/knovation/original/120990-6d40322c5805fa2a20d38b12f5e307a9.jpg?1661814826)
![Mr maffesoli.com: Line Plot Worksheet D [Pdf] Unknown Type Mr maffesoli.com: Line Plot Worksheet D [Pdf] Unknown Type](https://content.lessonplanet.com/knovation/original/120989-ab1c47a6d8c7390c6d5846a2343c47bd.jpg?1661814824)
![Mr Maffesoli: Line Plot Worksheet F: Study Guide and Intervention [Pdf] Unknown Type Mr Maffesoli: Line Plot Worksheet F: Study Guide and Intervention [Pdf] Unknown Type](https://content.lessonplanet.com/knovation/original/120991-d3e2569b1cd0f2b9a607650ddd145ee4.jpg?1661814827)
![Mr maffesoli.com: Line Plot Worksheet I [Pdf] Unknown Type Mr maffesoli.com: Line Plot Worksheet I [Pdf] Unknown Type](https://content.lessonplanet.com/knovation/original/120994-3f831049567a6f1e296a053ab80385b3.jpg?1661814830)
![Mr maffesoli.com: Line Plot Worksheet G [Pdf] Unknown Type Mr maffesoli.com: Line Plot Worksheet G [Pdf] Unknown Type](https://content.lessonplanet.com/knovation/original/120992-3b83403265c198c6a9d5caa75699cb61.jpg?1661814828)
![Mr maffesoli.com: Line Plot Review [Pdf] Unknown Type Mr maffesoli.com: Line Plot Review [Pdf] Unknown Type](https://content.lessonplanet.com/knovation/original/120995-b4a170e0fbb519748f856045f654f966.jpg?1661814831)