Illustrative Mathematics
Illustrative Mathematics: S Id Coffee and Crime
This task addresses many standards regarding the description and analysis of bivariate quantitative data, including regression and correlation. Given a scatter plot, students will answer a variety of questions about linear relationships,...
PBS
Pbs Mathline: Button, Button Lesson Plan [Pdf]
An integrated math and language arts instructional activity focusing on statistics. Students explore the concepts of estimation, data collection, data analysis, classification, graphing, and counting through the reading of the Button Box...
University of Georgia
University of Georgia: Inter Math: Box and Whisker Plot
Description of box-and-whisker plots and their uses, along with a visual representation. There are links to related terms, everyday examples, more information, and the interactive checkpoint involving box and whisker plots located in the...
Texas Instruments
Texas Instruments: Line of Best Fit
In this activity, students learn to collect data and plot the data. They use the manual-fit feature to form a line of best fit.
Texas Instruments
Texas Instruments: An Olympic Plot
In this activity, students find lines of best fit to model Olympic data.
CK-12 Foundation
Ck 12: Statistics: Scatter Plots and Linear Correlation
[Free Registration/Login may be required to access all resource tools.] In this tutorial, students learn how to interpret data through the use of a scatter plot.
Alabama Learning Exchange
Alex: Great Golly Graphs
This lesson plan asks students to create a survey project including graphs, questions, tables, and data analysis. It gives an assessment and ideas for remediation and extension as well as ways to manage behavior problems and reluctant...
The Franklin Institute
Frankin Institute Online: Group Graphing
This site from The Franklin Institute explores how to make a simple graph using a spreadsheet to portray survey data. It also gives a set of interesting sports-related web sites so that students can get statistical inforamtion.
Texas Education Agency
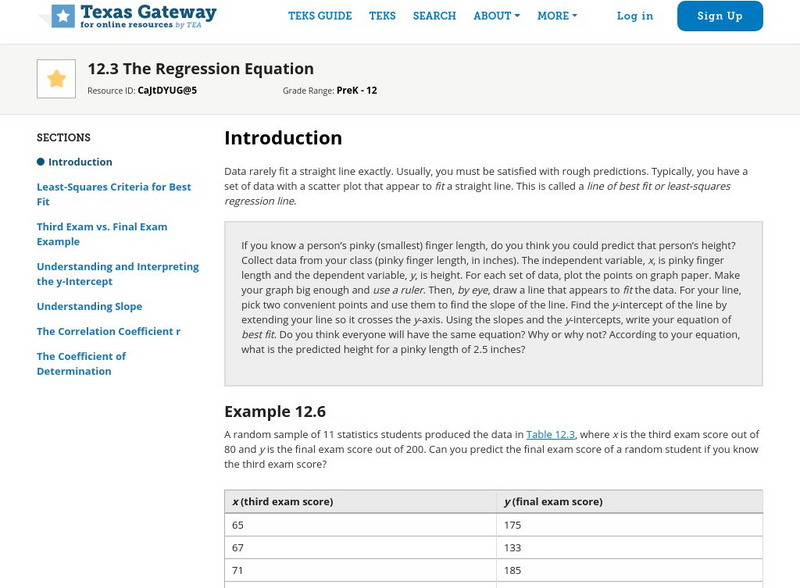
Texas Gateway: Tea Statistics: The Regression Equation
A tutorial on how to find the line of best fit or least-squares regression line for a set of data in a scatter plot using different methods and calculations.
University of South Florida
Florida Center for Instructional Tech: Famous People
Students estimate the ages of famous people, then create a scatterplot with the actual ages. This activity allows them to estimate with linear equations. You can access the age data through the "activity" link.
Texas Instruments
Texas Instruments: Mc Dougal Littell Middle School Math: Making Data Displays
Students will create data displays using a scatter plot and a line graph of the data and a circle graph of survey data.
Khan Academy
Khan Academy: Make Bar Graphs 1
Practice creating bar graphs (bar charts) from data sets. Students receive immediate feedback and have the opportunity to try questions repeatedly, watch a video or receive hints.
Science Education Resource Center at Carleton College
Serc: Average Rates of Change and Trend Lines
In this Spreadsheets Across the Curriculum activity, students calculate the average rate of change and graph a scatter plot of status high school dropout rate for 1975-2002. The module combines interpretation of rate of change in the...
PBS
Pbs Teachers: Galileo's Battle for the Heavens Plotting Sun Spots
For this activity, students follow in Galileo's footsteps as they examine the nature of sunspot cycles, define solar minimum and solar maximum, and graph data for a solar cycle. Then they will predict the next solar maximum and when the...
Louisiana Department of Education
Louisiana Doe: Louisiana Believes: Eureka Math Parent Guide: Collecting and Displaying Data
A guide to support parents as they work with their students in collecting and displaying data.
Math Drills
Math Drills: Statistics and Probability Worksheets
Download these free worksheets to sharpen your skills with statistics and probability. Sheets focus on collecting and organizing data, measures of central tendency (mean, median, mode, and range), and probability.
National Council of Teachers of Mathematics
The Math Forum: Chameleon Graphing: Coordinate Plane
Dive into this introduction to graphing in the coordinate plane, and meet a chameleon named Sam. Sam will help guide you through graphing points on a line, using negative numbers, and graphing points in the coordinate plane.
Math Graphs
Houghton Mifflin: Math Graphs: Line of Best Fit 3 [Pdf]
Students sketch the line that best approximates the data in a scatter plot. The scatter plot is available in PDF format.
Math Graphs
Houghton Mifflin: Math Graphs: Line of Best Fit 4 [Pdf]
Students sketch the line that best approximates the data in a scatter plot. The scatter plot is available in PDF format.
Cuemath
Cuemath: Linear Graph
A comprehensive guide for learning all about linear graphs with definitions, properties, their equations, how to plot or analyze them, solved examples, and practice questions.
Illustrative Mathematics
Illustrative Mathematics: 4.md, 5.md Button Diameters
The purpose of this task is for students to measure lengths to the nearest eighth and quarter-inch and to record that information in a line plot. Aligns with 4.MD.B.4 and CCSS.Math.Content.3.MD.B.4 Generate measurement data by measuring...
Alabama Learning Exchange
Alex: There's Perimeter in the School!
Students will work in groups to measure the perimeter of items around the school. They will record their data on a spreadsheet in the form of a line plot.
Texas Instruments
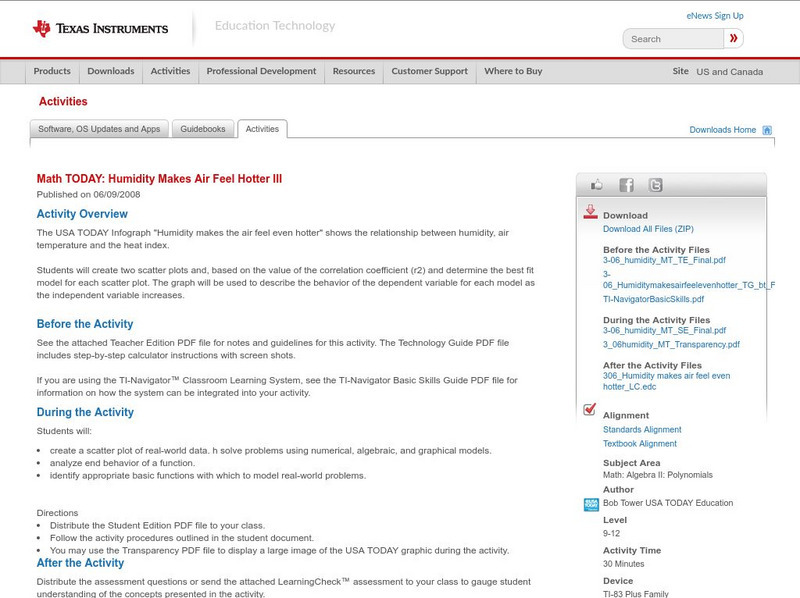
Texas Instruments: Math Today: Humidity Makes Air Feel Hotter Iii
Investigate the relationship among humidity, air temperature, and the heat index while learning about modeling data, evaluating functions, and describing the end behavior of a function. Students will use graphing calculator technology to...
Texas Instruments
Texas Instruments: Boat Registration and Manatee Deaths in Florida
Students will explore the data on boat registrations and manatee deaths in Florida. They will use the data, the graph of the data and the line of best fit to make predictions about the relationship of the data.


