Curated OER
Using Matrices for Data
In this matrices for data worksheet, 9th graders solve and complete 29 various types of problems that include using matrices to illustrate data. First, they determine the sum, difference and scalar product for each matrices shown. Then,...
Albert Shanker Institute
Economic Causes of the March on Washington
Money can't buy happiness, but it can put food on the table and pay the bills. The first of a five-lesson unit teaches pupils about the unemployment rate in 1963 and its relationship with the March on Washington. They learn how to create...
Curated OER
James and the Giant Peach Plot Analysis
It's all about the plot, main events, and story mapping with this lesson. As the class reads the novel James and the Giant Peach, they create an excitement graph that actually charts key events and moments of excitement. After creating...
Curated OER
Shaky New Zealand
Students explore geography by answering study questions in class. In this plate tectonics lesson, students identify the earthquake data concerning the country of New Zealand and answer questions regarding the data. Students identify...
Curated OER
Integration: Statistics, Measures of Central Tendency
Learners find the mean, median, and mode for each of four data sets. They are given two line plots, and compute the median and mode of the shown data. They find the median and mode for three stem and leaf plots. They solve two word...
Curated OER
Misleading Graphs
Students explore number relationships by participating in a data collection activity. In this statistics lesson, students participate in a role-play activitiy in which they own a scrap material storefront that must replenish its stock....
Curated OER
Scatter Plots
In this scatter plots worksheet, students solve and complete 4 different problems. First, they use the table shown to model the relation with a scatter plot and trend line and to predict the value of a variable when given the other...
Curated OER
Graphing and Analyzing
In this graphing and analyzing worksheet, 9th graders first state if each graph represents a linear or nonlinear relationship. Second, they create a difference table for each set of data presented and determine whether it represents a...
Pennsylvania Department of Education
Equal Groups
Students explore statistics by completing a graphing activity. In this data analysis lesson, students define a list of mathematical vocabulary terms before unpacking a box of raisins. Students utilize the raisins to plot data on a line...
Curated OER
Least Squares
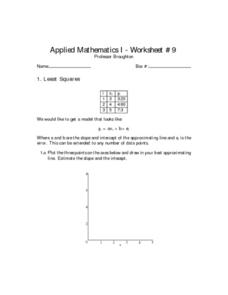
For this least squares worksheet, students solve 6 different problems that include the least squares of numbers. First, they plot 3 points on the axes shown and draw in their best approximating line. Then, students estimate the slope and...
Curated OER
Pick A Short Story
Students select a short story and apply various literary elements they have used throughout the year. They deconstruct a short story according to plot, setting, characterization, and theme. Students create a PowerPoint.
Curated OER
Confusing Colors!
Fourth graders collect data, graph their data, and then make predictions based upon their findings. They's interest is maintained by the interesting way the data is collected. The data collection experiment is from the psychology work of...
Curated OER
Favorite Survey
Fourth graders collect and organize data for charts and bar graphs by questioning their classmates. They utilize a worksheet imbedded in this plan which guides them through their 'favorites' survey.
Curated OER
Statistics
In this statistics worksheet, 9th graders solve and complete 5 different word problems that include different data. First, they determine if there is an explanatory and a response variable in the given data set. Then, students create a...
Curated OER
Line 'Em Up!
Students find coordinate points on a grid and create a line graph with those points. This lesson should ideally be used during a unit on various types of graphs. They make and use coordinate systems to specify locations and to describe...
Curated OER
When Dinosaurs Ruled the World
Students graph the varying sizes of dinosaurs. In this math and dinosaur lesson, students view dinosaur models and compare the different shapes and sizes of the dinosaurs. Students complete a dinosaur math activity, read The Dinosaur...
Curated OER
Project Interactive--Stem and Leaf Plotter
In this excellent stem and leaf plotter worksheet, students construct, arrange and write a report of how to interpret the leaves they collect in this data analysis. Students answer 4 detailed questions regarding the data analysis...
Curated OER
How Much Will I Spend On Gas?
Students construct a linear graph. In this graphing lesson, students determine a monthly budget for gasoline. Students construct a t-chart and coordinate graph to display data. Resources are provided.
Curated OER
Statistics Newscast in Math Class
Students study sports teams, gather data about the teams, and create a newscast about their data. In this sports analysis lesson, students research two teams and define their statistical data. Students compare the two teams, make...
Curated OER
What is a Cloud
Third graders study clouds and how they are formed. They write acrostic poems about clouds and analyze and graph temperature data collected during varying degrees of cloud cover.
Curated OER
Writing a Fictional Narrative
Fourth graders write a fictional narrative using the computer. They can use files to help them focus on including a beginning, middle and end, characters, setting and plot or planning a story by answering questions.
Curated OER
Whose Breakfast isn't for the Birds?
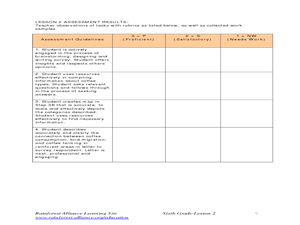
Learners explore coffee production. In this cross-curriculum rainforest ecology instructional activity, students research regions where coffee comes from and investigate how the native birds in the rainforest are effected by coffee...
Curated OER
Earth and Space Science: Exploring Earthquakes
Students explore earthquakes. In this earthquake activity, students research earthquakes and identify where they take place. Students use map skills to track down earthquake locations. There are internet sites suggested in this activity.
Curated OER
Fairytale Favorites
Students access George MacDonald's Fairytales website, read exerpts of pre-selected tales, select their favorite and communicate that information via the internet to another class.


