Khan Academy
Khan Academy: Picture Graphs (Pictographs) Review
Picture graphs are a fun way to display data. This article reviews how to create and read picture graphs (also called pictographs).
Khan Academy
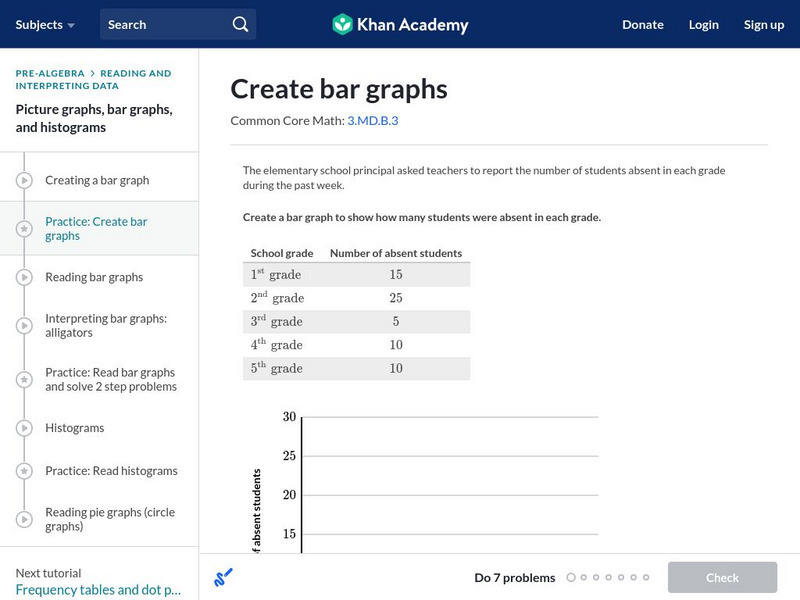
Khan Academy: Create Bar Graphs
Create a bar graph with the data given. Students receive immediate feedback and have the opportunity to try questions repeatedly, watch a video tutorial, or receive hints about creating bar graphs. CCSS.Math.Content.3.MD.B.3 Draw a...
Better Lesson
Better Lesson: Greedy Gordy Can't Decide Working With Venn Diagrams
Students have been working with pictographs and bar graphs. Now they take their learning a step further by working with Venn Diagrams.
Science and Mathematics Initiative for Learning Enhancement (SMILE)
Smile: Apples a Peel to Me
This lesson plan helps children understand how to graph data by using both real objects, apples, and pictures of apples. Great activity for a variety of themes.


