Curated OER
We Are Having a Party! Part II
Second graders, in groups, participate in a four-station rotation model to solve problems. They use coins and dice for stations one, two, and three.
Curated OER
Favorite Christmas Carols
Third graders take a survey of friends' and family members' favorite Christmas carols. They illustrate a favorite Christmas carol and have students try to guess the name of the carol based on the picture.
Curated OER
Delicious Graphing
Fourth graders sort trail mix by type and use that information to create different types of graphs for comparing.
Curated OER
Usage and Interpretation of Graphs
Students review graphing and use processing skills to solve problems.
Curated OER
Home on the Biome
Fifth graders study six major biomes, graph temperature and rainfall, and present their findings to the class.
Curated OER
Color Your World with Changes --- the Camouflage Game
Seventh graders, after predicting dominant colors foud in their habitat or garden, visit heir area on a monthly basis. They search for colored toothpicks, then graph the results, determining the dominant color for the month.
Curated OER
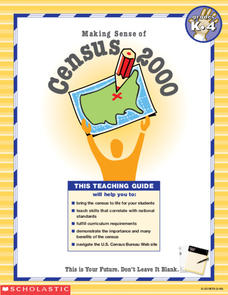
Making Sense of the Census
In this unit of lessons, students make sense of the Census. They examine why a census is taken and participate in activities.
Curated OER
What's Your Favorite Stuffed Animal?
Second graders gather information in a survey and interpret the results using a tally chart, a table, and a bar graph. They' present their results of the during the final group discussion. The subject of the survey is favorite stuffed...
Curated OER
Do You See What I See?
Students observe and describe different objects seen under a microscope and compare the individual perspectives of what was seen.
Curated OER
Going My Way?
Young scholars discuss how each one of them leaves school each day. They create and analyze a class graph displaying the information collected.
Curated OER
A Rainbow Under the Sea: How Do Animals Survive in the Ocean?
Second graders, with adult help, create a PowerPoint presentation on a selected ocean animal.
Curated OER
Boats Graph
Students read from the Bible about the travels of Paul, particularly the boat rides. They trace Paul's travels on a map of Asia Minor. Students review a field trip they took and make a graph showing the numbers of each type of boat they...
Curated OER
Classroom Census
Students take a classroom census. They count in sets, sortan classify groups and ascertain the value of counting.
Scholastic
Scholastic: Study Jams! Math: Data Analysis: Pictograph
Watch short video clips that show step by step how to organize data and create a pictograph. Then check for understanding by testing yourself.
Government of Alberta
Learn Alberta: Math Interactives: Exploring Election Data
Using actual Alberta provincial election results, students have the opportunity to interpret election data using a variety of graph types. Pictographs, line graphs, bar graphs, circle graphs, and data tables are covered in this...
Louisiana Department of Education
Louisiana Doe: Louisiana Believes: Eureka Math Parent Guide: Problem Solving With Length, Money, and Data
A guide to support parents as they work with their students with problem solving with length, money, and data.
Cuemath
Cuemath: Data Handling
This comprehensive guide about data handling helps with understanding how the study of data handling and graphical representation of the data along with other tools help us in dealing with numerical data. Includes solved examples and...
Mangahigh
Mangahigh: Data: Use and Interpret Pictographs
This site provides students practice with the concept of pictographs. Students can learn about the topic by completing an interactive tutorial. Students can then take a ten question timed test to practice the skill.
E-learning for Kids
E Learning for Kids: Math: Pizza (Italian) Restaurant: Data and Chance
In this interactive site, students practice with bar and picture graphs by helping a pizza place collect and analyze their data.
Cuemath
Cuemath: Pictographs
A comprehensive guide for learning all about pictographs with definitions, solved examples, and practice questions.
ClassFlow
Class Flow: Data Analysis Using Graphing
[Free Registration/Login Required] This flipchart allows students to analyze data using appropriate graphs, including pictographs, histograms, bar graphs, line graphs, circle graphs, and line plots introduced earlier, and using...
E-learning for Kids
E Learning for Kids: Math: Orange Trees, Olive Trees: Data and Capacity
In this lesson, students collect data related to a question, compare and order the capacity of containers, and interpret picture graphs.
BBC
Bbc: Representing Data
This BBC Math Bite tutorial for line graphs, pictograms, and frequency polygons features an exam in which students draw and interpret statistical diagrams.


