Curated OER
Pictogram 1 and 2
In this mathematical worksheet, young scholars experience problem solving two pictograms dealing with favorite animals and rainy days.
Curated OER
Practice Dividing by 8
In this dividing by 8 worksheet, students use the data in the math table to help them complete the pictograph chart on the right. Students use the pictograph to help them answer the six word problems.
Curated OER
Showing Favorites
In this tally chart worksheet, students use the tally chart on the page to answer 2 questions. They then solve the last 2 questions using their own tally chart.
Curated OER
Graphing Activity #3
For this graph worksheet, students use information in a tally chart to complete a pictograph of favorite pizza toppings and answer 4 related questions. A website reference for additional resources is given.
Curated OER
The Indus Valley Civilization
In this social studies word search worksheet, students identify and locate vocabulary terms related to the Indus Valley Civilization. There are 17 words located in the puzzle.
Explore Learning
Student Exploration: Forest Ecosystem
In this ecosystem exploration worksheet, students complete 2 prior knowledge questions, then use "Forest Ecosystem Gizmo" to conduct several activities, completing short answer questions when finished.
Curated OER
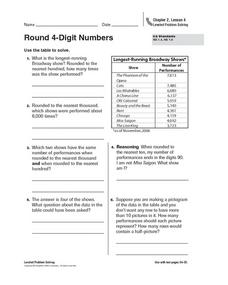
Round 4-Digit Numbers
In this rounding numbers practice worksheet, students sharpen their problem solving skills as they solve 6 story problems that require them to round 4-digit numbers.
Curated OER
Let's Graph It! Pre-Test
For this graphing worksheet, students complete a set of 10 multiple choice questions, clicking on a link to see correct answers or print the page.
Curated OER
Graphs in the News
In this graphs worksheet, learners locate 2 kinds of graphs in the newspaper and answer short answer questions about them. Students complete 3 questions.
Curated OER
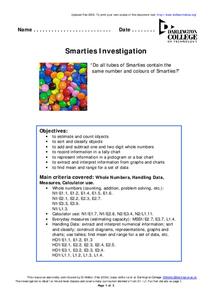
Smarties Investigation
In this math worksheet, learners participate in an investigation of Smarties candy. For example, students estimate how many candies they have in each color, count the actual number, and record the information in a tally chart.
Government of Alberta
Learn Alberta: Math Interactives: Exploring Election Data
Using actual Alberta provincial election results, students have the opportunity to interpret election data using a variety of graph types. Pictographs, line graphs, bar graphs, circle graphs, and data tables are covered in this...
Teachnology
Teachnology: Survey Teaching Theme
Survey Theme provides an excellent collection of free sample worksheets, teacher resources, lesson plans and interactive media for grades k-12.
Teachnology
Teachnology: Survey Teaching Theme
Survey Theme provides an excellent collection of free sample worksheets, teacher resources, lesson plans and interactive media for grades k-12.


