Alabama Learning Exchange
Ice Cream Sundae Survey
Young scholars analyze data through graphs. They will complete a class survey on ice cream sundaes and tally and graph the responses. They then analyze the information from the class graph.
American Statistical Association
Scatter It! (Predict Billy’s Height)
How do doctors predict a child's future height? Scholars use one case study to determine the height of a child two years into the future. They graph the given data, determine the line of best fit, and use that to estimate the height in...
Curated OER
How Soluble Is It?
Is sugar more soluble than salt? Experiment with water and solubility with an elementary science activity. After interpreting data from a bar chart, fifth graders use different types of sugar to determine if the size of sugar particles...
Curated OER
Independent Plant Growth Experiment
This is an awesome lesson filled with tons of engaging learning activities. Over a period of weeks learners will make observations, collect plant and analyze plant data, read and review agricultural articles, design and conduct an...
Curated OER
Reading Tally Chart
As learners explore data analysis have them practice reading tally charts using these examples. They answer basic questions about each of three charts, employing addition and subtraction skills. For example, a chart tallying t-shirts...
Curated OER
Cross Cultural Transportation and Resources Exchange
Students examine various modes of transportation. They explore regional transportation options and discover options available in their area. Students survey types of transportation people use in their area. Using spreadsheet data,...
ARKive
Handling Data: African Animal Maths
Handling and processing data is a big part of what real scientists do. Provide a way for your learners to explore graphs and data related to the animals that live on the African savannah. They begin their analysis by discussing what they...
Curated OER
Reading Bar Charts
Help kids understand how to collect data through surveys, organize data in a bar chart, then analyze their findings. There are three different surveys for learners to conduct, a full description of all the parts of a bar chart, and three...
Curated OER
Where We Live
Who has the most? Young learners practice charting data using familiar information. They help fill out a classroom chart by recording the number of people, pets, televisions, etc. in their home. Guiding questions help them investigate...
Curated OER
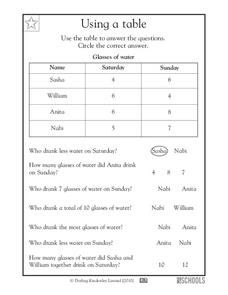
Using a Table
Tables are no help if your scholars can't read them; provide some excellent beginner-practice using this table example and accompanying comprehension questions. Learners examine the data first, which charts the number of glasses of water...
Curated OER
Line Graphs
Let's take a look at Luis' bike ride! Scholars examine a line graph charting a 20-kilometer bike ride over the course of six hours. They answer six questions about the data requiring the understand the concepts of each axis and the line...
Curated OER
Obstacles to Success: Misleading Data
Eleventh graders explore how data reported by country agencies can mislead the public intentionally or unintentionally. In this Cross Curricular activity, 11th graders analyze charts and graphs in order to draw conclusions. Students...
Curated OER
Ornithology and Real World Science
Double click that mouse because you just found an amazing lesson! This cross-curricular Ornithology lesson incorporates literature, writing, reading informational text, data collection, scientific inquiry, Internet research, art, and...
Beyond Benign
Plastic Bags
Paper or plastic? Explore the environmental effects of using plastic bags through mathematics. Learners manipulate worldwide data on plastic bag consumption to draw conclusions.
Space Awareness
The Climate in Numbers and Graphs
Weather versus climate: weather relates to short time periods while climate averages the weather of a period of many years. Scholars learn about average temperature and precipitation in various climate zones and then apply statistics...
Math Worksheets Land
Pie or Circle Graphs - Guided Lesson
A guided lesson activity reinforces pie graph skills using a given set of data. Each problem requires young mathematicians to create a circle graph using five colors, and to provide a key that goes along with the graph.
CK-12 Foundation
Pie Charts: Soda Party
Using the interactive, pupils create a pie chart that represents the percentage of sodas bought for a party. Individuals need to determine the percentage and number for the final variety of drinks. The learners determine how the...
Curated OER
Reading Timetable
Word problems, telling time, and reading charts all come together on this page. After reviewing a table of different travel times for a bus, a tram, a taxi, and a trolley, third graders solve word problems about arrival times and stop...
University of North Carolina
Figures and Charts
Sometimes words aren't the best way to get information across to the reader. The eighth handout in the 24-part Writing the Paper series describes different type of figures and charts to display complex information in a paper....
Virginia Department of Education
May I Have Fries with That?
Not all pie graphs are about pies. The class conducts a survey on favorite fast food categories in a lesson on data representation. Pupils use the results to create a circle graph.
School Improvement in Maryland
Pollution Data
Smog? Vog? What is being done about air pollution? Government classes investigate federal and state programs designed to improve air quality, and then develop a proposal for further actions that are needed.
Curated OER
Data Handling
In this data handling worksheet, students interpret data found in table, graphs and charts. They organize data and draw bar charts. This two-page worksheet contains 2 multi-step problems.
Curated OER
Charts, Maps, and Graphs Lesson on the Holocaust
Students practice interpreting data. In this Holocaust lesson, students research selected Internet sources and examine charts, maps, and graphs regarding the Jewish populations in and out of Europe. Students respond to questions about...
Curated OER
Data Display
Students explore different ways to display data. In this statistics instructional activity, students create pie charts, bar graphs and line graphs to show data. Students then write a paragraph discussing which types of graphs are helpful...


