Hi, what do you want to do?
Vision Learning
Visionlearning: Data: Using Graphs and Visual Data in Science
An explanation of how data can be turned into visual forms which can help people comprehend information easier than observing numbers.
Scholastic
Scholastic: Cultivating Data
Students will understand key concepts of data analysis and their graphic representations. Students will construct and interpret data tables, line plots, box-and-whisker plots and stem-and-leaf plots, scatterplots with line of best fit,...
PBS
Pbs: Interpreting Stories and Graphs
This interactive exercise focuses on how line graphs can be used to represent mathematical data and provides an opportunity to translate actions from a story into graph form, then to write your own story to coincide with a line graph.
Other
Bscs: Asking and Answering Questions With Data
In this self-directed lesson, students use graphs and maps of water quality to investigate relationships between variables to answer questions. A handout with everything the student needs to complete this lesson is available as a PDF or...
Science Buddies
Science Buddies: Data Analysis for Advanced Science Projects
The importance of data analysis in science projects is explained. Describes common mistakes young scientists make. The article then discusses how to find out what the standard methods of data analysis are for the type of research you...
Better Lesson
Better Lesson: Graphing Using a Frequency Table
Multiple graphs can represent the same data set and make the information easier to understand.
Texas Education Agency
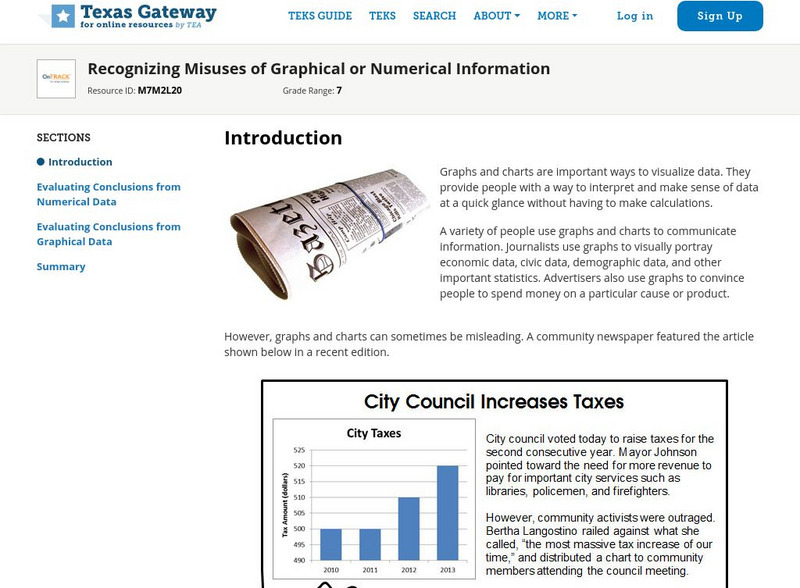
Texas Gateway: Recognizing Misuses of Graphical or Numerical Information
Given a problem situation, the student will analyze data presented in graphical or tabular form by evaluating the predictions and conclusions based on the information given.
PBS
Pbs Kids Afterschool Adventure!: Operation: All About Us Activity Plan
It's time to stand in the spotlight! During this Afterschool Adventure, children will learn about and practice a variety of math skills as they gather information about their favorite subject-themselves! Children will start out by...
Texas Instruments
Texas Instruments: Boat Registration and Manatee Deaths in Florida
Students will explore the data on boat registrations and manatee deaths in Florida. They will use the data, the graph of the data and the line of best fit to make predictions about the relationship of the data.
York University
York Univ.: Statistical Graphics for Multivariate Data
Provides several graphical representations of multivariate data. This paper explains the graphs such as the scatter plot and several other graphs as well. Site is presented in notes and outline format.
Cuemath
Cuemath: Frequency Distribution Table
A comprehensive guide for learning all about frequency distribution tables with definitions, how to create a frequency distribution table, and the formulas and graphs related to frequency distributions. With solved examples and...
Other
Bscs: Frog Symphony
In this self-directed instructional activity, students use maps and graphs of data to investigate the habitats and time of year and day to hear a full chorus of frogs. A handout with everything the student needs to complete this...
Texas Instruments
Texas Instruments: Domain and Range of Graphs
This activity will allow the students to determine the domain and range of many different graphs presented to them through TI-Navigator using the activity center.
BioEd Online
Bio Ed Online: Balloon Blast
In the following lesson students are asked to devise a plan to measure the distance of a balloon's flight, predict the direction a balloon will travel as it deflates, learn about Newton's Laws of Motion, experience Newton's Third Law,...
TeachEngineering
Teach Engineering: Temperature Tells All!
Students are introduced to the health risks caused by cooking and heating with inefficient cook stoves inside homes, a common practice in rural developing communities. Students simulate the cook stove scenario and use the engineering...
Other
Kindergarten lessons.com: Graphing Activities
Graphing activities for preschool and kindergarten include collecting data and organizing it in a variety of ways. There are lots of fun things to do in this area of math and the activities integrate well with science and literacy...
PBS
Pbs: The Lowdown: Living Wages in Ca: Ratio and Rate in the Real World
In this KQED infographic, find out how much an adult in different-sized households needs to make to pay for basic monthly living expenses. In the accompanying classroom activity, students solve real-life problems involving rate and ratio...
Purple Math
Purplemath: Stem and Leaf Plots
Explains how to create a stem-and-leaf plot from a data set. Demonstrates how to format a clear stem-and-leaf plot.
Other
Bscs: Budburst Lilac Festival
In this self-directed activity, students use graphs and maps of lilac phenology data to determine the best time to host a lilac blossom festival in their area. A handout with everything the student needs to complete this lesson is...
Illustrative Mathematics
Illustrative Mathematics: F If.6 Mathemafish Population
For this task, students are presented with a table and a graph and are asked to summarize the data and report the findings of a project by the Environmental Protection Agency to contain the effects of an invasive species on a fish...
TeachEngineering
Teach Engineering: Bubbling Plants
Students learn a simple technique for quantifying the amount of photosynthesis that occurs in a given period of time, using a common water plant (Elodea). They can use this technique to compare the amounts of photosynthesis that occur...
Calculator Soup
Calculator Soup: Descriptive Statistics Calculator
This is a statistics calculator; enter a data set and hit calculate. Descriptive statistics summarize certain aspects of a data set or a population using numeric calculations. Examples of descriptive statistics include: mean, average,...
American Museum of Natural History
American Museum of Natural History: Ecology Disrupted: Chesapeake Bay Food Web
In this comprehensive lesson unit, students examine how overfishing has affected Chesapeake Bay's ecosystem. They will study food webs from the past and present and graph related data.
TeachEngineering
Teach Engineering: Does Weight Matter?
Using the same method for measuring friction that was used in the previous lesson (Discovering Friction), students design and conduct an experiment to determine if weight added incrementally to an object affects the amount of friction...
Other popular searches
- Data Collection and Graphs
- Graphs and Data Display
- Graphs and Data Tables
- Collect Data and Graphs
- Graphs and Data
- Graphs and Data Handling
- Science Data and Graphs
- Data Displays and Graphs
- Analze Data and Graphs
- Interpret Graphs and Data
- Graphs and Data Analysis
- Probability Data and Graphs


