Curated OER
Butterfly Life Cycle
Second graders explore biology. In this life cycle lesson, 2nd graders act out the stages a caterpillar goes through to become a butterfly. They spend days prior to this lesson observing caterpillars they have collected and developing...
Curated OER
Catching Rays
Students investigate solar collectors. In this energy lesson, students create and demonstrate solar collectors. They will use measurement, data collecting, and analyze their findings to determine the best orientations for their solar...
Curated OER
Measurement of Biotic and Abiotic Objects
Students identify biotic and abiotic factors. In this environmental study lesson plan, students conduct a series of experiments to collect and record data and draw conclusions based on the results.
Curated OER
Buzzing is BEE-lieving
Students investigate insects. In this insect lesson plan, students explore various insect models and identify the characteristics of each. Students observe insects outside and tally how many insects they observe.
Curated OER
Usage and Interpretation of Graphs
Students explore graphing. In this graphing activity, students predict how many shoe eyelets are present in the classroom. Students count eyelets and work in groups to organize and chart the data collected. Students put all the data...
Curated OER
Weather With a Latitude
Students read the temperature from a thermometer. In this weather lesson, students read a thermometer and record the temperature at twenty minute intervals. Students discuss results.
Curated OER
Excel for Beginners
In this Excel lesson, students set a formula to check their homework. Students also use clipart, work in groups, and learn to use the tools in the drop-down list.
Curated OER
Virtual Field Trip
Are we there yet? Young trip planners learn about their state and plan a trip. They will select sites to see in three cities in their state, and record associated costs in a spreadsheet. While this was originally designed as a...
Curated OER
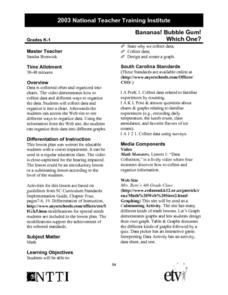
Bananas! Bubble Gum! Which One?
Students design and create a graph of data they have collected on their favorite candy bars. They explore how to organize data as well.
Curated OER
Graphing with the Five Senses
Students collect data and record it on a bar graph. In this data graphing instructional activity, each small group of students is assigned to collect data on one of the five senses. They then practice a song that helps them remember the...
Curated OER
Confusing Colors!
Fourth graders collect data, graph their data, and then make predictions based upon their findings. They's interest is maintained by the interesting way the data is collected. The data collection experiment is from the psychology work of...
Curated OER
Unit 2: Lesson 7
Students are introduced to spreadsheets. They conduct a survey of television viewing time of different shows based on different age categories. Students work in small groups. They collect, data and interpret the data from a survey.
Pennsylvania Department of Education
Eye to Eye
Students practice the concept of posing mathematical questions regarding themselves and their surroundings. In this eye to eye lesson, students gather data about eye color from their classmates. Students organize their data in order to...
Curated OER
R-Project
Students analyze the outcome of a scientific experiment using free downloadable software. They collect experimental data to use statistical software to determine if the observations are likely due to the treatment or random chance.
Curated OER
We Are Having a Party! Part I
Second graders use data analysis skills in order to plan a class party. They graph possible times for the party noting the range for times. They discuss how mathematicians find and use the range to analyze data.
Curated OER
Weather Where We Are
Students investigate the reports of local weather. They identify types of weather data and correlate it to the conditions. Using the data students draw a picture of the current weather. They conduct the same investigation for all four...
Curated OER
Graphing Pockets
Second graders explore graphing. They count the number of pockets on their clothes and use Microsoft Excel to enter their data. Students create a class graph displaying their findings.
Curated OER
Favorite Survey
Fourth graders collect and organize data for charts and bar graphs by questioning their classmates. They utilize a worksheet imbedded in this plan which guides them through their 'favorites' survey.
Curated OER
Bones and Math
students identify and explore the connection between math and the bones of the human body. Students collect data about bones from their classmates and from adults, apply formulas that relate this data to a person's height, and organize...
Curated OER
A Picture is Worth a Thousand Words
Sixth graders work to write questions for a class survey. In this survey lesson, 6th graders survey their class members by asking the 4 questions they developed and will record their answers on the culminating assessment...
Curated OER
You Are What You Eat (High School)
Students evaluate data from a statistical chart or graph which they find in a newspaper or magazine.
Curated OER
Capturing the Wind
Learners collect and analyze data about wind speed. They build a Lego wind sail and measure the wind speed with a rotation sensor. They use software to analyze the data.
Curated OER
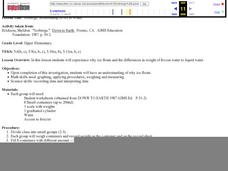
Icebergs: Relationship of Ice to Water
Students experience why ice floats and the differences in weight of frozen water to liquid water. Students explore why ice floats. They use math skills such as: graphing, applying procedures, weighing and measuring. Students also use...
Curated OER
Descriptive Statistics
Students demonstrate how to use frequency and scatter diagrams. In this statistics lesson, students are introduced to different techniques of representing data. Students sort and graph data on a worksheet and use a frequency diagram to...
Other popular searches
- Collecting and Recording Data
- Collecting and Organizing Data
- Collecting and Graphing Data
- Collecting and Using Data
- Games on Data Collecting
- Collecting Weather Data
- Collecting and Comparing Data
- Patterns Data Collecting
- Math Data Collecting
- Patterns, Data Collecting
- Collecting and Charting Data
- Patterns\, Data Collecting


