Curated OER
Leonardo da Vinci
Students select appropriate tools and technology to perform tests, collect data, and display data. They construct appropriate graphs from data and develop qualitative statements about the relationships between variables.
Curated OER
Scatter Plots
Seventh graders investigate how to make and set up a scatter plot. In this statistics lesson plan, 7th graders collect data and plot it. They analyze their data and discuss their results.
Curated OER
Corn-Crop is a Bin-Buster
Learners calculate percent change and create lists of data. They enter the corresponding bushels of corn measured in billions to their list and display, then convert the acres into scientific notation and use the value on the home screen...
Curated OER
Geometric Sequences and Series
Learners find common ratios of geometric sequences on a spreadsheet. Using this data, they create scatter plots of the sequences to determine how each curve is related to the value of the common ratio. They will consider whether series...
Curated OER
Probing Below the Surface of Mars
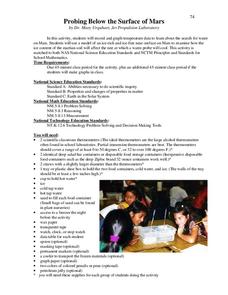
Students simulate the search for water in Mars using simple apparatus. In this space science lesson, students explain how soil temperature affects the cooling of probes. They graph the data collected from the simulation.
Curated OER
Connecticut Wildlife: Biodiversity and Conservation Status of Our Vertebrate Populations
Students explore the different types of vertebrates found in their area. In this environmental science lesson, students perform a case study on the Common Raven. They analyze data collected from research and create charts and graphs.
Curated OER
Are You My Little Peanut?
Fourth graders explore the mass and length of peanuts by pretending to parent a peanut. In this mode, median and range lesson students graph their measurements and then use them to find the mode, median and range. Students discuss peanut...
Curated OER
Survey Say...
Students examine a variety of charts and graphs that present data in a format that is easy to read. They work in groups to conduct a survey amongst their classmates. The data collected from the survey is then put on a bar graph.
Curated OER
Bird Bulletins
Students, in groups, create a survey to investigate how much their community knows about birds. They graph their findings using a bar graph. Using the data collected, they develop an advertising campaign to increase community awareness...
Curated OER
Graphing With a Spreadsheet
Fourth graders review how to create bar, line and circle graphs. Using jelly beans, they collect data and present it in a bar graph form. They enter the same data into a spreadsheet and watch as the program creates the same graph. They...
Curated OER
Discovering Mitosis in Onion Roots
Pupils discover the different stages of mitosis by examining onion roots under a microscope, drawing diagrams of what they see, and organizing collected data in a chart and create a pie graph from their lab data.
Curated OER
Piecewise Modeling with Multiple Functions: Federal Debt
Young scholars analyze data on debt and write an equation. In this statistics lesson, students are given data from different time periods, and are asked to graph and analyze the data. They work in groups, and are assigned different parts...
Curated OER
Let's Get Physical
Learners collect data using the CBL. In this statistics instructional activity, students predict the type of graph that will be created based on the type of activity the person does. The graph represents heart rate depending the level of...
Curated OER
Choosing the Best Graph
Eighth graders produce and examine two sets of data and create what they believe to be the most appropriate graphs to represent these sets of data. After completing the pre-assessment, they discuss reasons for using each type of graph...
Curated OER
Graphing Population Around the World
Students define specific vocabulary necessary for understanding population data. They collect, analyze, and interpret specific data. They utilize computer programs in order to create graphs of collected data.
Curated OER
Do Not Open Until May 2000!
Students create a time capsule. In this time capsule lesson, students collect and record data about themselves to be stored in a time capsule that will be opened at the end of the year.
Curated OER
Graphs Galore
Fourth graders conduct surveys to collect data. They analyze and interpret the data, then determine which type of graph is appropriate for the data. Students use the data to make predictions, discover patterns and draw conclusions...
Curated OER
What's Your Favorite? Survey And Graphing Project
Sixth graders create and edit spreadsheet documents using all data types, formulas and functions, and chart information. They collect and organize data that be portrayed in a graph that they create using EXCEL.
Curated OER
Don't Lose Your Load!
Students create graphs using collected data. In this algebra lesson, students use spreadsheet in Excel to create graphs to interpret their data and make predictions. They rewrite word problems using algebraic expressions.
Curated OER
Graphing Your Motion
Seventh graders investigate velocity and speed. For this Vernier Probe lesson, 7th graders will use probes to calculate motion, speed, and velocity of an object. They will create a graph of their collected data.
Curated OER
Using Charts and Graphs to Study East Asia's Modern Economy
Students examine East Asia's modern economy. In groups, classmates use the internet to compare the resources, products, and economy of specified countries. After collecting the data, pupils create charts, tables and graphs. They...
Curated OER
Motion Musing
Young scholars investigate graphing a line. In this algebra lesson, students collect data on the path of a skateboarder. They collect how fast the board is traveling along a straight line and graph their results.
Curated OER
$$$eaweed
Students compare and evaluate the world's different seaweeds. In this investigative instructional activity students study seaweed and the harvesting of it. They then interpret the data collected and graph the seaweed...
Curated OER
Can You Guess The Flavor?
Second graders conduct a tasting experiment. In this senses lesson, 2nd graders read The Five Senses and brainstorm different tastes. They work in pairs, one blindfolded and the other recording. The blindfolded student eats one skittle...
Other popular searches
- Data Collection and Graphs
- Collect Data and Graphs
- Recording Data on Graphs
- Recording Data Into Graphs
- Data Collection Graphs


